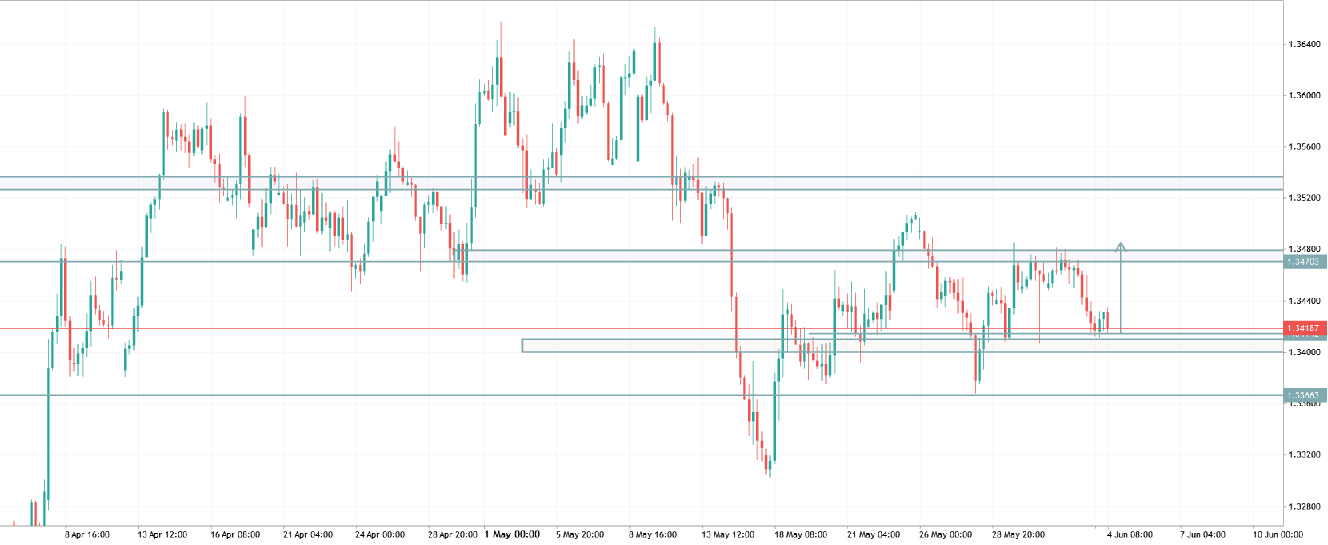
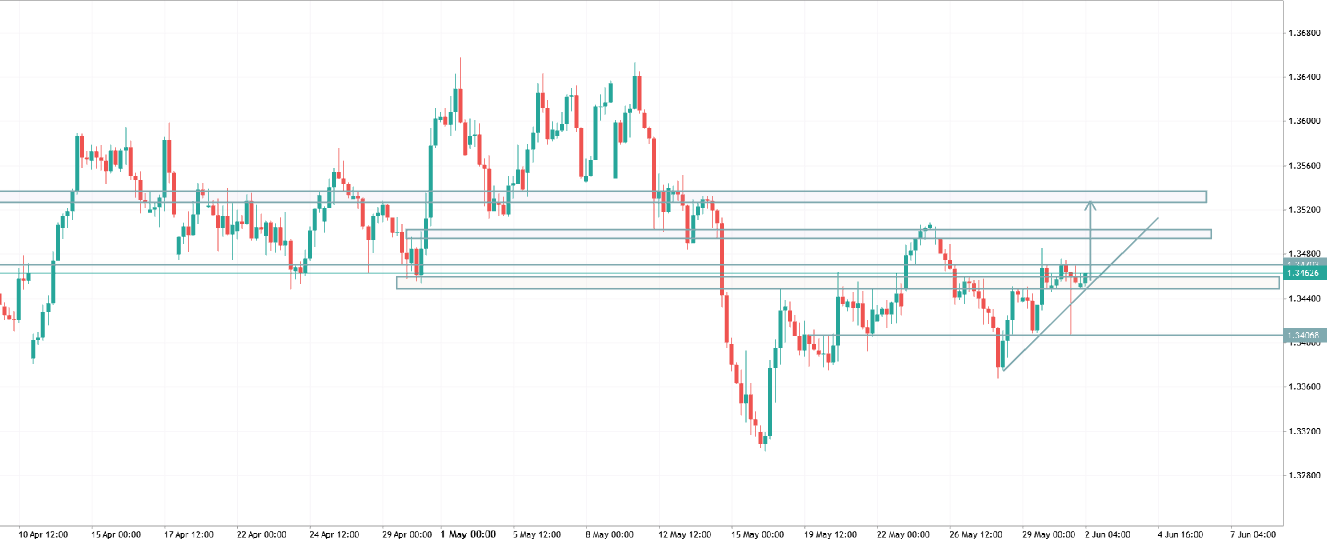
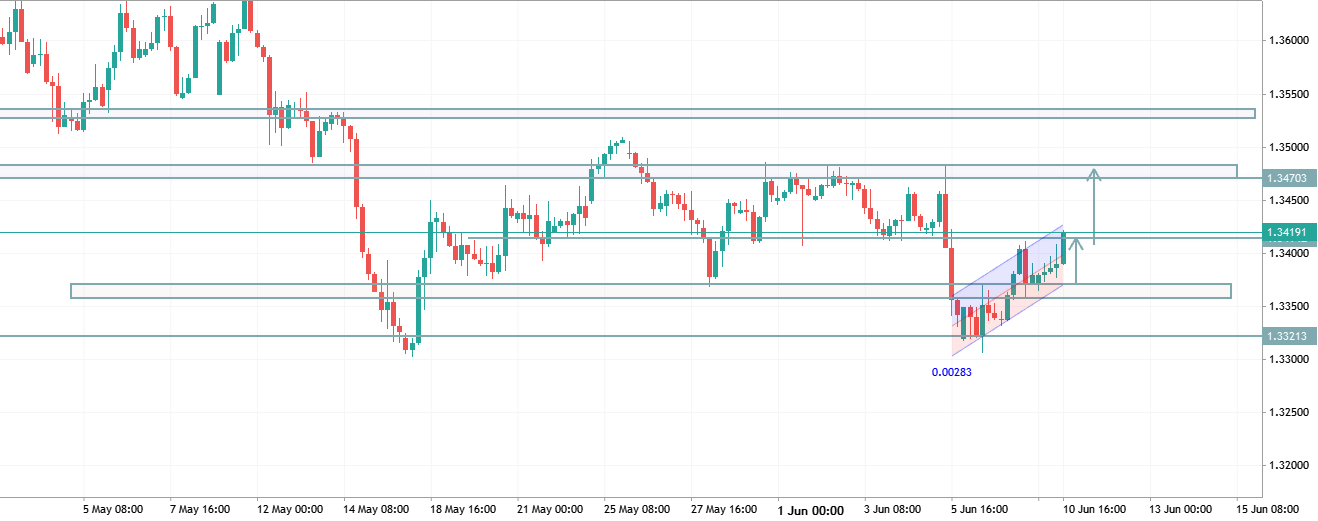
Overview

Trading Ideas for 2026: ECL - Technical Forecast and Levels ECL
Trading Ideas for 2026: ECL - Technical Forecast and Levels
Weekly price is located above Ichimoku cloud in the bullish area of he chart. The price is on ranging within 251.21/285.91 support/resistance channel waiting or direction. - If the price breaks support level at 251.21 to below so the primary bearish reversal will be started. - If the price crosses 285.91 resistance so the primary bullish trend will be continuing. Trading Summary: ranging, waiting for direction 0
newdigital Sergey Golubev 2026.01.31 05:18
Trading Ideas for 2026: META - Technical Forecast and Levels META
Trading Ideas for 2026: META - Technical Forecast and Levels
Weekly price is located inside Ichimoku cloud for the ranging within 594.8/686.6 s/r channel waiting for direction. If the price breaks resistance at 686.6 to above so the primary bullish trend will be continuing with 797.1 as a next possible target. If the price breaks support level at 594.8 to below so the primary bearish reversal will be started with 570.6 possible target to re-enter. Recommendation: ranging, waiting for direction 0
newdigital Sergey Golubev 2026.01.24 06:51
Trading Ideas for 2026: TSLA - Technical Forecast and Levels TSLA
Trading Ideas for 2026: TSLA - Technical Forecast and Levels
Weekly price is above Ichimoku cloud in the bullish area of the chart. The price was bounced from 498.6 resistance level to below for ranging within 393.6/498.6 s/r levels. If the price breaks resistance at 498.6 so the strong bullish trend will be continuing. If the price crosses the support level at 393.6 so the secondary correction to the bearish reversal will be started with 297.6 as a possible target. Recommendation: ranging for direction 1
newdigital Sergey Golubev 2026.01.22 08:07
Trading Ideas for 2026: AMD - Technical Forecast and Levels AMD
Trading Ideas for 2026: AMD - Technical Forecast and Levels
The weekly price s above Ichimoku cloud in the bullish area of the chart. The Chinkou Span of Ichimoku indicator broke historical price to above for the good bullish breakout, but Stochastic indicator is showing the overbought condition for the price. For now, the price is on ranging within 194.2/267.6 s/r channel waiting for direction of the strong bullish trend to be continuing or to the secondary correction to the bearish reversal to be started with 149.1 as the next target. Recommendation: bullish ranging; watch the levels 1
newdigital Sergey Golubev 2026.01.22 06:32
Trading Ideas for 2026: USDTHB - Technical Forecast and Levels USDTHB
Trading Ideas for 2026: USDTHB - Technical Forecast and Levels
Weekly price is located far below Ichimoku cloud in the bearish area of the chart. The rice is testing the descending triangle pattern with support level at 30.96 to below for the primary bearish trend to be continuing. Alternatively, the price will be on secondary ranging within 30.96/32.90 s/r channel waiting for the direction of the bullish reversal to be started or the bearish trend to be continuing. Recommendation: ranging bearish; watch the price to be crossed the s/r levels for direction. 1
newdigital Sergey Golubev 2026.01.18 08:23
Trading Ideas for 2026: NVIDIA - Technical Forecast and Levels NVDA
Trading Ideas for 2026: NVIDIA - Technical Forecast and Levels
<p>Weekly price is located above SMA indicators in the bullish area of the chart. The price is on ranging within 169.4 support level and 212.0 resistance level. If the price breaks support level at 169.4 to below so the secondary correction within the primary bullish trend will be started; if the price crosses resistance level at 212.0 to above so the good bullish trend will be continuing. Recommendation: ranging for direction.</p> 1
newdigital Sergey Golubev 2026.01.17 08:45
Trading Ideas for 2026: USD/CAD - Technical Forecast and Levels USDCAD
Trading Ideas for 2026: USD/CAD - Technical Forecast and Levels
Weekly price is located near and below Ichimoku cloud in the bearish area of the chart. The price was bounced from 1.3642 support to break the symmetric triangle pattern to above and it was stopped near the border of Ichimoku cloud. If the price breaks the resistance level at 1.4140 so the primary bullish reversal will be started; if the price breaks support level at 1.3642 to below so the bearish trend will be continuing; if not so the price will be on ranging within s/r channel waiting for direction. 1
newdigital Sergey Golubev 2026.01.15 16:50
NIKKEI 225 Index: ranging to correction or bullish to be continuing?
225
JPN225
NIKKEI 225 Index: ranging to correction or bullish to be continuing?
NIKKEI 225 Index weekly price is located far above 200 SMA, 100 SMA and 55 SMA as well in the bullish area of the chart. The price is trying to break the ascending triangle pattern with resistance level at 53937 to above for the bullish trend to be continuing. Alternatively, the price will be on ranging condition within s/r levels at 44010/53937 waiting for direction of the strong bullish trend to be continuing or the secondary correction to be started. 1
newdigital Sergey Golubev 2026.01.13 07:21