BTC: 60,000 — the level where the next move may be decided BTCUSD Bitcoin vs US Dollar

BTC: 60,000 — the level where the next move may be decided

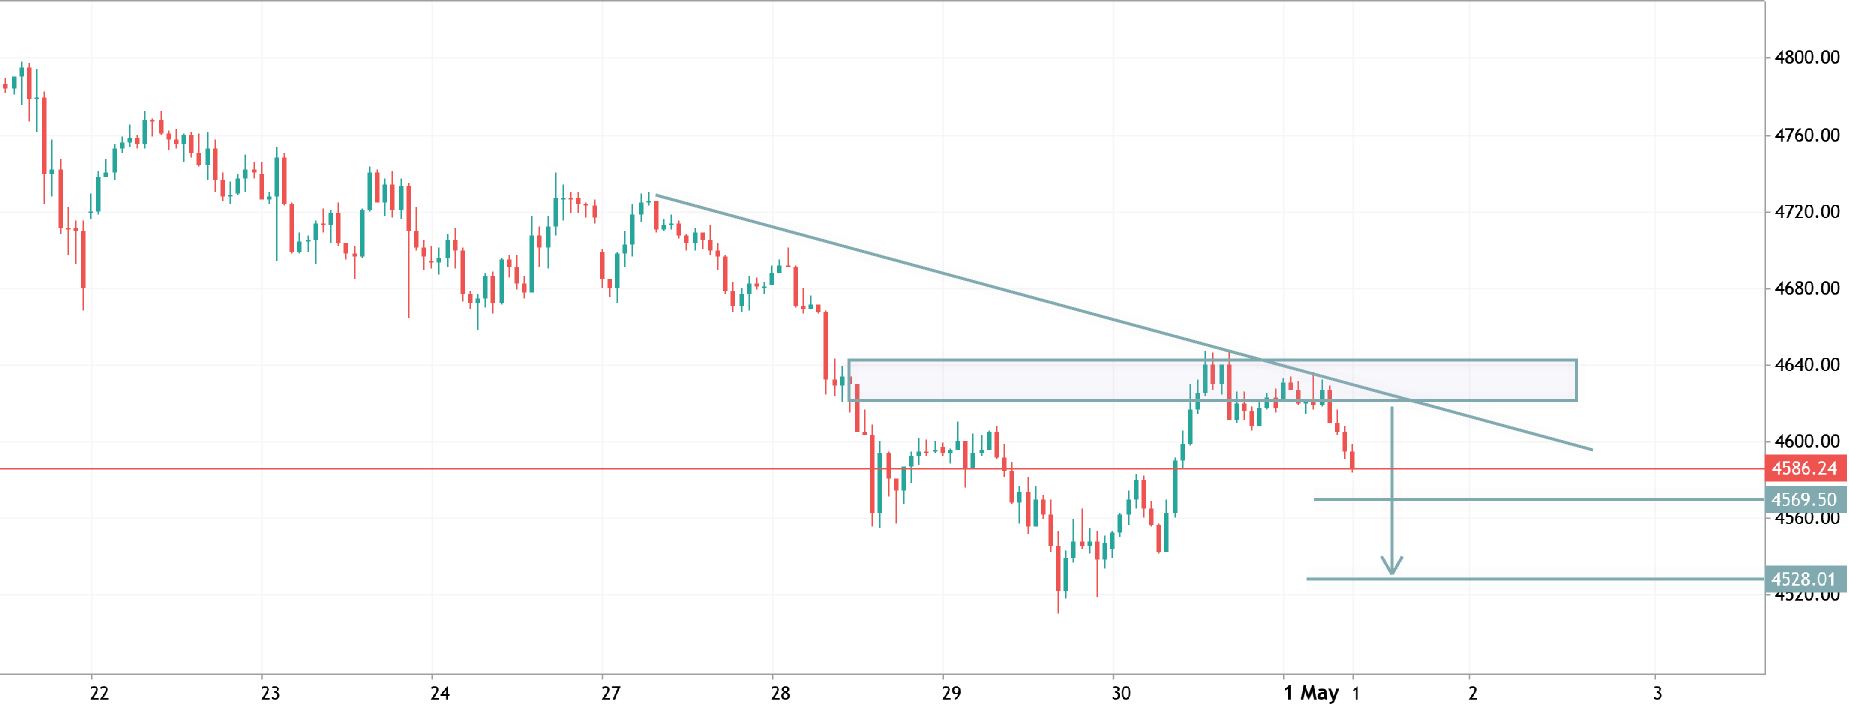
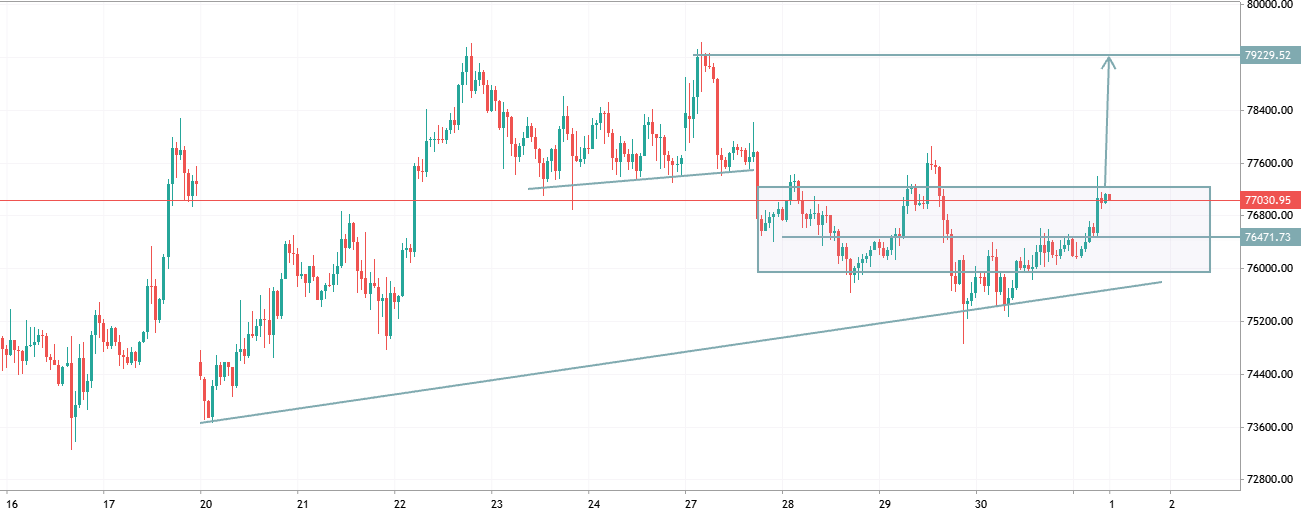
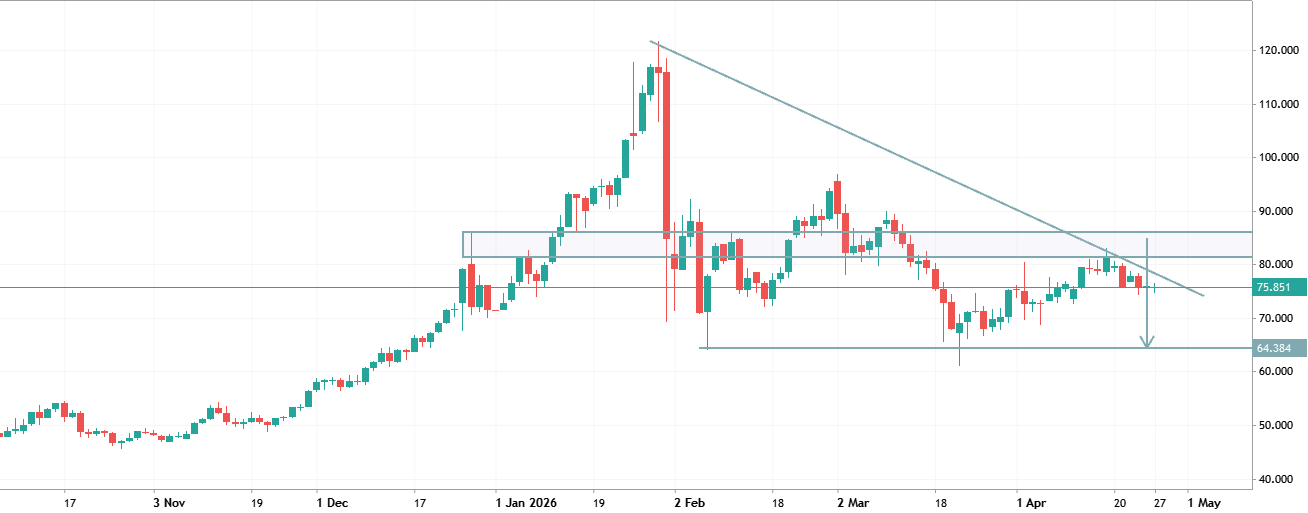
BTC: 60,000 — the level where the next move may be decided Bitcoin is approaching a very important zone. The 60,000 level now looks like the line between market stabilization and a deeper correction. As long as the price holds above 60,000, buyers still have a chance to defend the structure and push BTC into a rebound. In that scenario, the first major resistance area is around 64,000–65,000. This is where a new battle between buyers and sellers may begin. However, if BTC breaks below 60,000 and confirms below this level, the picture becomes much weaker. In that case, the market may start moving toward the next key area: 53,000–50,000. This would no longer look like a simple local pullback, but rather an attempt by sellers to take control. The key point is not just a temporary break below
BTC: 60,000 — уровень, где решается следующий импульс BTCUSD Bitcoin vs US Dollar

BTC: 60,000 — уровень, где решается следующий импульс

BTC: 60,000 — уровень, где решается следующий импульс Биткойн подошёл к очень важной зоне. Уровень 60,000 сейчас выглядит как граница между удержанием рынка и переходом в более глубокую коррекцию. Пока цена держится выше 60,000, у покупателей ещё остаётся шанс защитить структуру и показать отскок. В таком сценарии первой сильной зоной сопротивления будет область 64,000–65,000. Именно там, на мой взгляд, может начаться новая борьба между покупателями и продавцами. Но если BTC пробивает 60,000 и закрепляется ниже, картина становится заметно слабее. В этом случае рынок может начать движение к следующей зоне интереса — 53,000–50,000. Это уже не просто локальный откат, а полноценная попытка продавцов забрать инициативу. Ключевой момент — не сам прокол уровня, а закрепление. Ложный пробой 60,000
EURAUD Currency Strength View: EURAUD Long Euro vs Australian Dollar

EURAUD Currency Strength View:

EUR is the strongest currency today (+140 pips, 6/7 coherence). 6 of 7 EUR pairs confirm the direction. AUD is the weakest (-139 pips, 7/7 coherence). All 7 AUD pairs confirm the weakness. Maximum spread: 279 pips between the two baskets. MATTRIX BasketViewer suggests: EURAUD BUY When both sides show high coherence, the move tends to follow through. In Chart Veritas — confirm with your own analysis. #Big8 Sum = 0 | mattrix8x.com
GBPUSD H1 ANALYSIS GBPUSD Pound Sterling vs US Dollar

GBPUSD H1 ANALYSIS

GBPUSD H1 Analysis GBPUSD is showing a potential bullish recovery after respecting a key demand zone. Price is forming a rounded bottom structure and holding above short-term support, suggesting buyers are regaining control. 📈 Bullish Scenario: A breakout above the current resistance zone could trigger momentum toward 1.3460 – 1.3480. 📉 Bearish Scenario: Failure to hold above 1.3400 may lead to another retest of lower support levels. Bias: Bullish while price remains above support. Watch for confirmation through a strong breakout candle.
GBPUSD H1 ANALYSIS GBPUSD Pound Sterling vs US Dollar

GBPUSD H1 ANALYSIS

GBPUSD H1 Analysis GBPUSD is showing a potential bullish recovery after respecting a key demand zone. Price is forming a rounded bottom structure and holding above short-term support, suggesting buyers are regaining control. 📈 Bullish Scenario: A breakout above the current resistance zone could trigger momentum toward 1.3460 – 1.3480. 📉 Bearish Scenario: Failure to hold above 1.3400 may lead to another retest of lower support levels. Bias: Bullish while price remains above support. Watch for confirmation through a strong breakout candle.
EURUSD H1 ANALTSIS EURUSD Euro vs US Dollar

EURUSD H1 ANALTSIS

EURUSD | H1 Analysis EURUSD is trading inside a descending channel and showing signs of bullish recovery from the lower boundary. Buyers are attempting to regain control after a prolonged correction. 📈 Bullish Scenario: A breakout above the channel resistance could drive price toward the 1.1625 – 1.1645 supply zone. 📊 Key Levels: 🔹 Support: 1.1590 – 1.1600 🔹 Resistance: 1.1625 – 1.1645 Outlook: Price is testing a critical breakout area. Holding above recent lows keeps the bullish bias intact, with upside targets remaining in focus. 🚀📉 #EURUSD #Forex #TechnicalAnalysis
BTCUSD H1 ANALYSIS BTCUSD Bitcoin vs US Dollar

BTCUSD H1 ANALYSIS

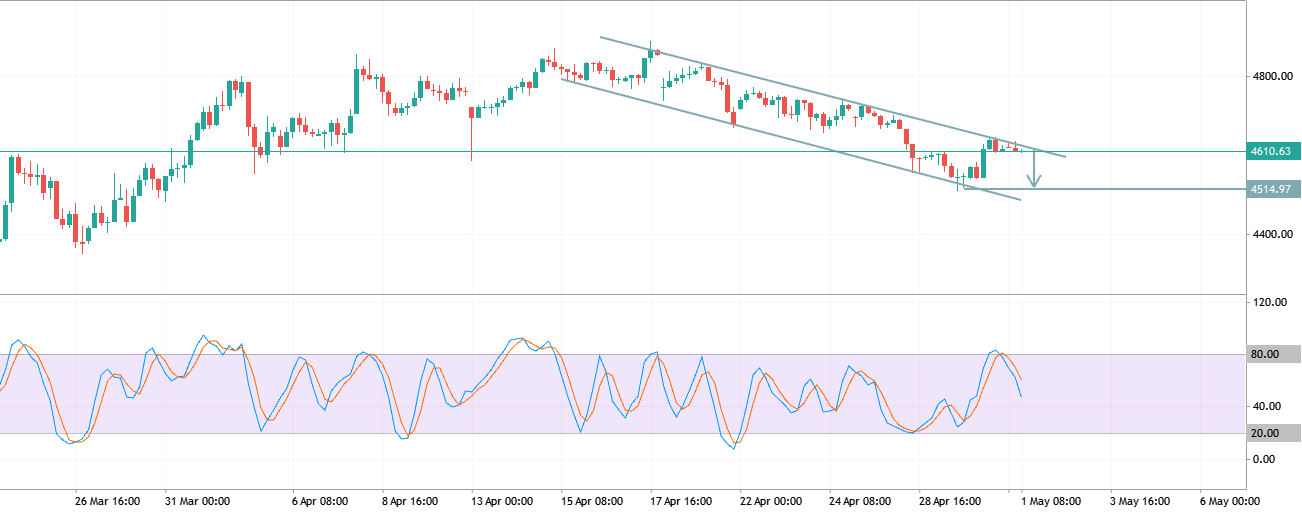
BTCUSD | H1 Analysis BTC is approaching a key breakout zone after a prolonged bearish channel decline. Price is holding above recent lows and attempting to build bullish momentum. 📈 Bullish Setup: A confirmed breakout above channel resistance could trigger a move toward 67.2K – 69.0K. 📊 Key Levels: Support: 63.3K – 63.8K Resistance: 67.2K – 69.0K Outlook: Momentum is shifting in favor of buyers. A clean breakout and hold above resistance may accelerate the recovery toward higher targets. 🚀📊
XAUUSD TRADE IDEA XAUUSD Long Gold vs US Dollar

XAUUSD TRADE IDEA

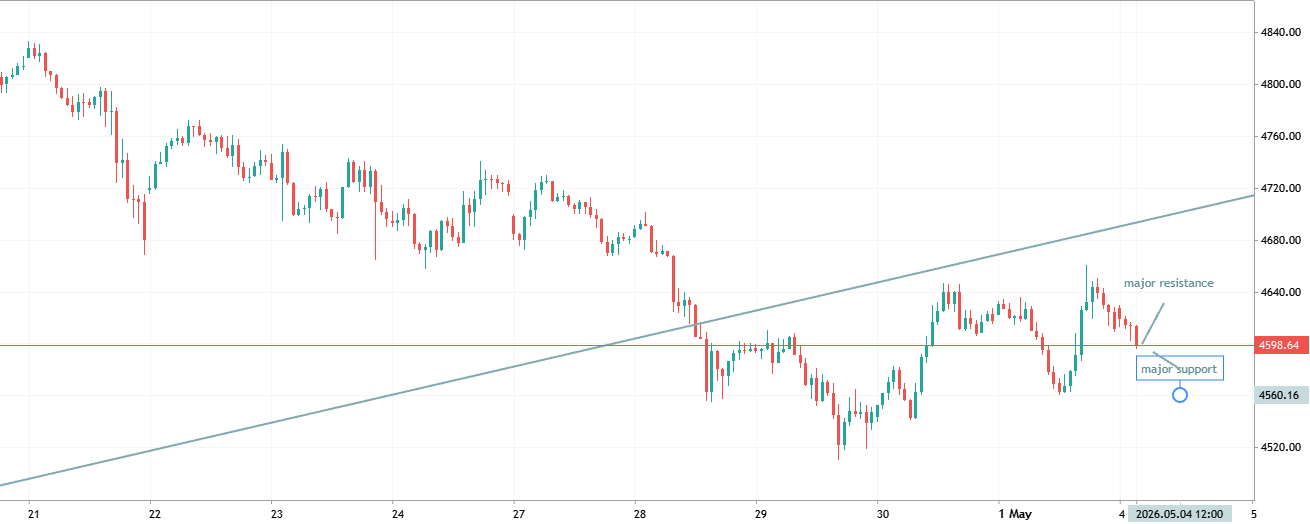
BUY TRADE SETUP (H4) Entry: 4445–4450 Stop Loss: 4425 Take Profit 1: 4465 Take Profit 2: 4505 Take Profit 3: 4570 Reasoning: Strong support zone around 4444–4450 has been defended multiple times. Recent candles show buyers stepping in from support. Risk-to-reward favors longs while price remains above 4444 . Confirmation Entry: Conservative traders can wait for an H4 close above 4465 before entering. Invalidation: H4 close below 4444 would invalidate the bullish setup and increase the probability of a move toward 4410–4380 . Bias: Bullish above 4444 , targeting 4505 and potentially 4570 .
XAUUSD H1 ANALYSIS XAUUSD Gold vs US Dollar

XAUUSD H1 ANALYSIS

XAUUSD H1 Analysis Gold is trading inside a descending channel and has reached a key demand zone around 4430–4440. Price action suggests bearish momentum is weakening, with a potential bullish breakout forming. 📈 Bullish Scenario: A break above the channel resistance could trigger a move toward 4485, followed by 4530 as the next major target. 📉 Bearish Scenario: Failure to hold above the support zone may extend the decline toward lower liquidity levels. Bias: Cautiously Bullish while price remains above support. Watch for confirmation before entry. #XAUUSD #Gold #Forex #TechnicalAnalysis #MQL5 #TradingView
The Market Is Giving Gold Buyers Another Chance XAUUSD Long Gold vs US Dollar

The Market Is Giving Gold Buyers Another Chance

Gold is currently showing signs of a potential bullish continuation after completing a corrective move. Based on the Fibonacci retracement levels marked on the chart, price is approaching a high-probability demand zone where institutional buyers may look to re-enter the market. 🎯 Buy Zone: 4454 – 4415 🎯 Target: 4800+ ⚠️ Wait for confirmation before entering and always manage your risk. Plan the trade. Trade the plan. 💯
XAUUSD (Gold) — Bullish Structure, But Liquidity Says Wait XAUUSD Gold vs US Dollar

XAUUSD (Gold) — Bullish Structure, But Liquidity Says Wait

Gold has transitioned into a bullish market structure after printing a clear Bullish CHoCH , followed by a Higher Low (HL) and a Higher High (HH) . From a pure structure perspective, buyers remain in control and the broader trend remains constructive. However, the MaMI Structure + Liquidity Fusion Engine is not issuing a buy signal yet. What the Structure Says ✅ Bullish CHoCH confirmed ✅ Higher Low protected ✅ Higher High established ✅ Bull Trend remains intact The current structure suggests that institutional buyers successfully reclaimed control after the previous bearish phase. What Liquidity Says The most recent liquidity event was a Previous Day Low (PDL) Sweep . This is generally considered bullish because price swept downside liquidity, trapped sellers, and aggressively recovered