XAUUSD (Gold) – Key Support Buy Zone XAUUSD Long Gold vs US Dollar

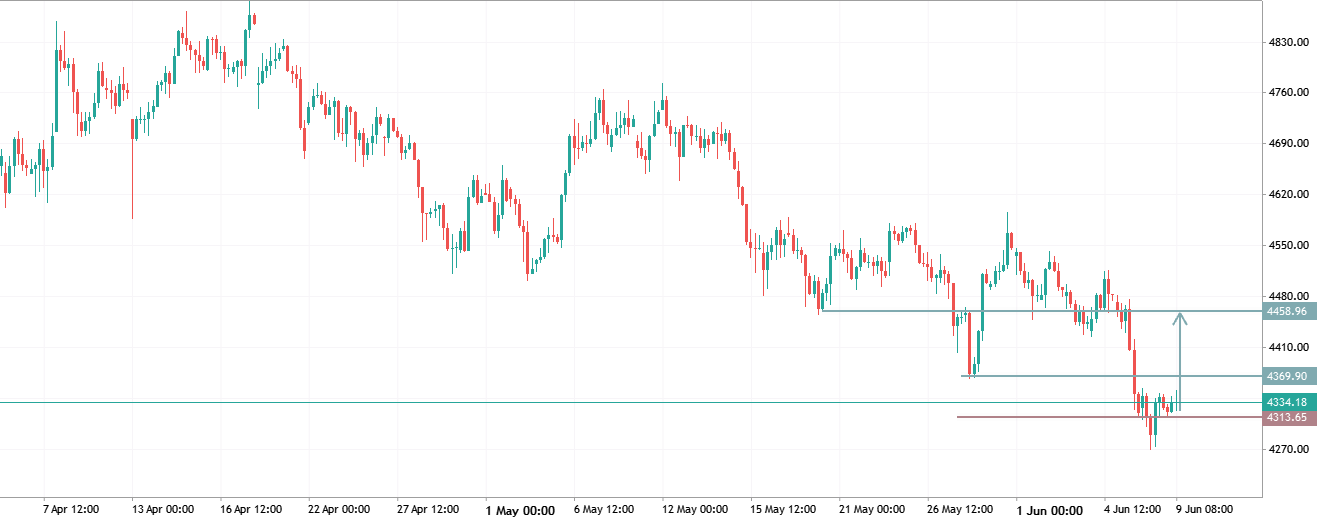
XAUUSD (Gold) – Key Support Buy Zone

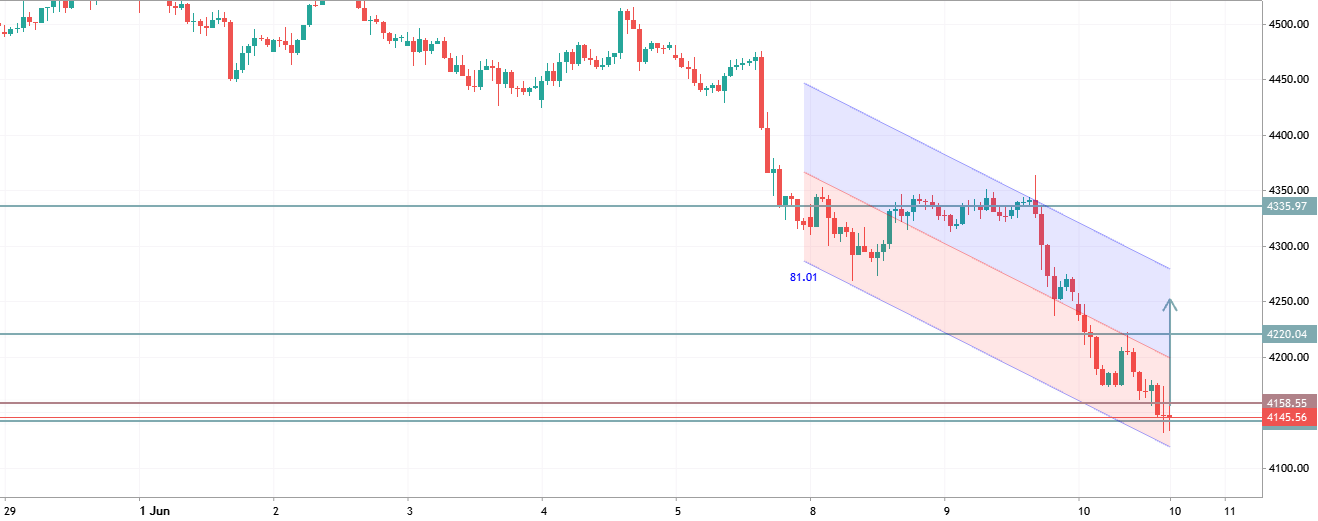
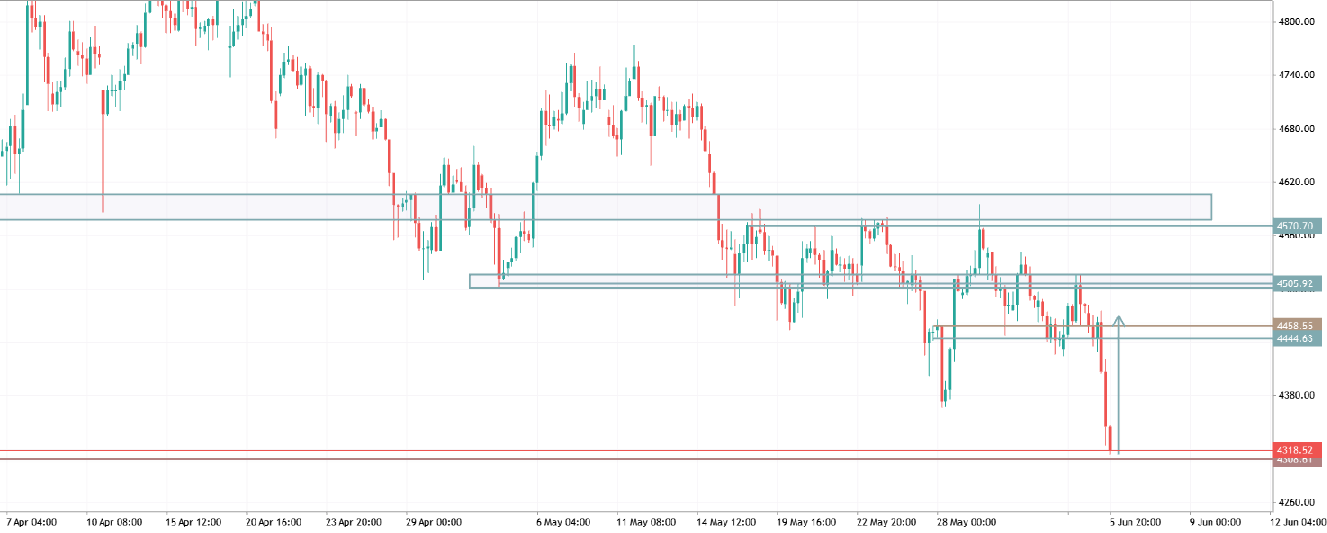
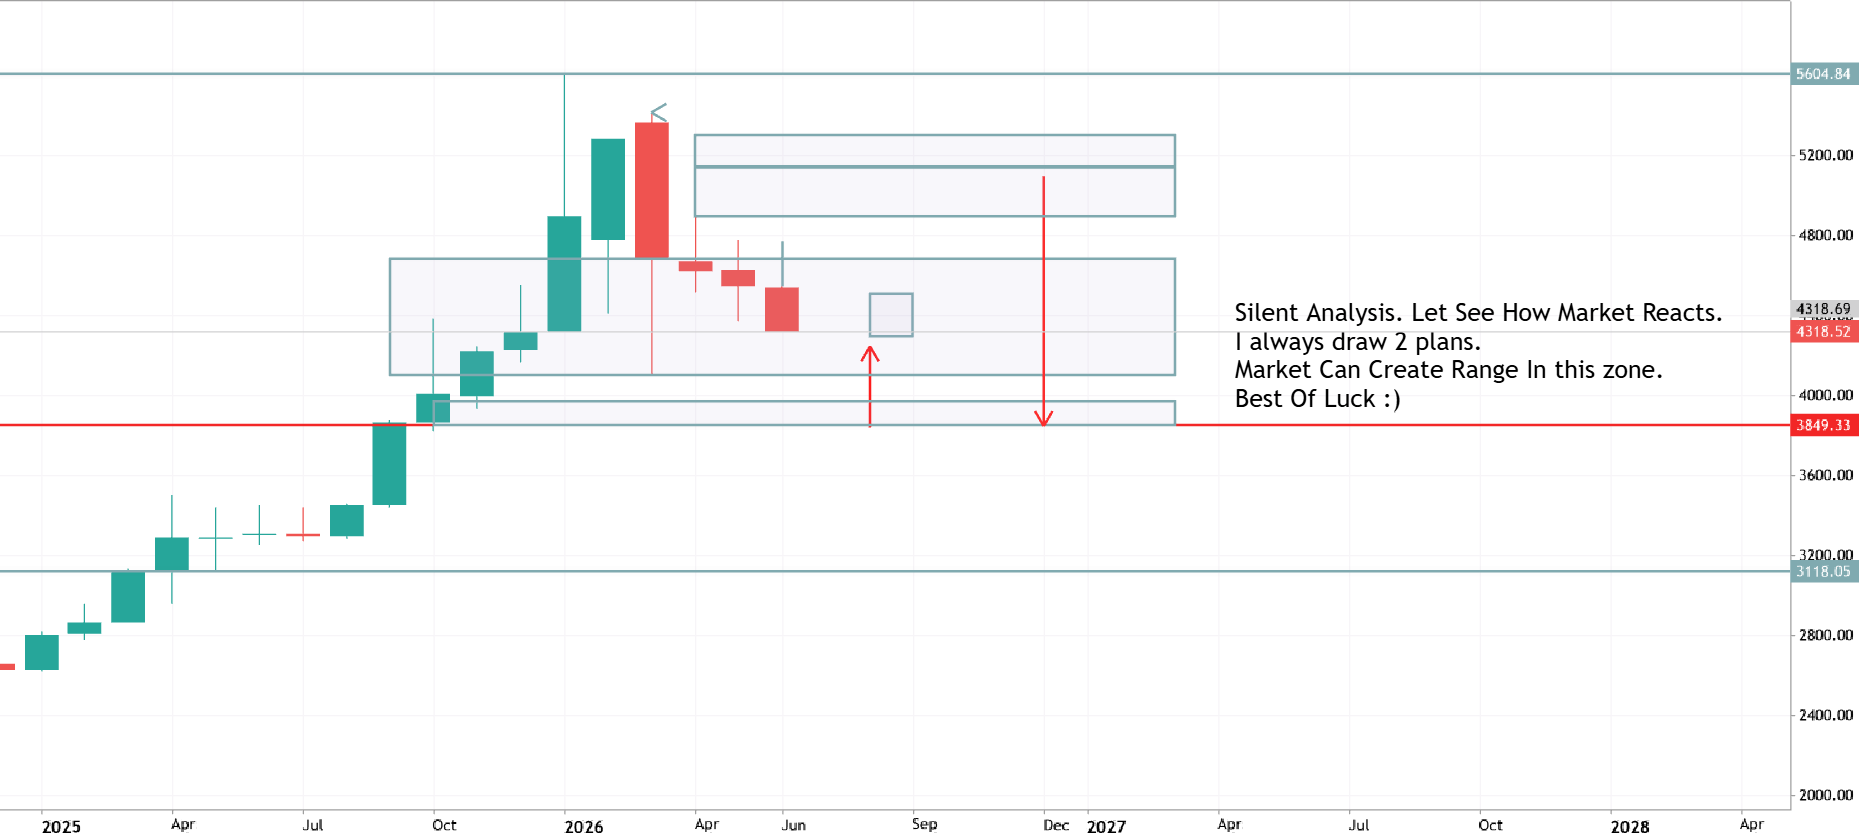
🟢 XAU/USD Buy Signal Buy Zone: 4314 – 4304 Stop Loss: 4290 Take Profit 1: 4324 Take Profit 2: 4340 Take Profit 3: 4360 📈 Gold is approaching the 4314–4304 buy zone, which could provide a favorable area for a day-trade buy. If price holds this zone and shows bullish confirmation, Gold could continue higher toward 4324, followed by 4340 and 4360. Consider securing partial profits at TP1 and TP2 while allowing the remaining position to target TP3. Proper risk management and disciplined execution remain essential. Risk Disclaimer: Trading forex and commodities involves substantial risk. Always use proper risk management and never risk more than you can afford to lose.
SPCX: $145 support and $155 breakout define the next move SPCX SpaceX Space Exploration Technologies Corp

SPCX: $145 support and $155 breakout define the next move

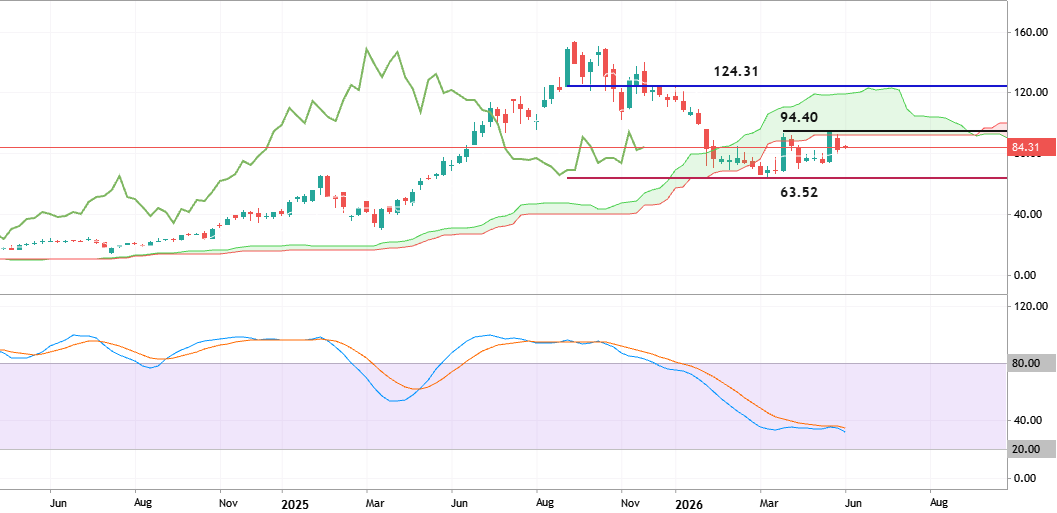
Space Exploration Technologies (NASDAQ: SPCX) | Daily chart | September 10, 2026 View: neutral until price confirms either side of the current range. Horizon: 1–3 weeks. SPCX closed September 9 at $147.55, down 3.86%, after trading between $145.55 and $153.00. The prior session reached $155.00, making that level the clearest near-term breakout test. Chart reading The blue line is the 20-day simple moving average and the lower panel is RSI(14), both based on closing prices. Price has recovered sharply from the early-August low and remains above a rising 20-day average, so the short-term structure is constructive. RSI is around the low 60s: momentum is positive, but the failed push through $155 shows that buyers have not secured a breakout. Key levels Green $145.14: the September 8 low and
XAUUSD (Gold) Buy Setup 10 September 2026 XAUUSD Long Gold vs US Dollar

XAUUSD (Gold) Buy Setup 10 September 2026

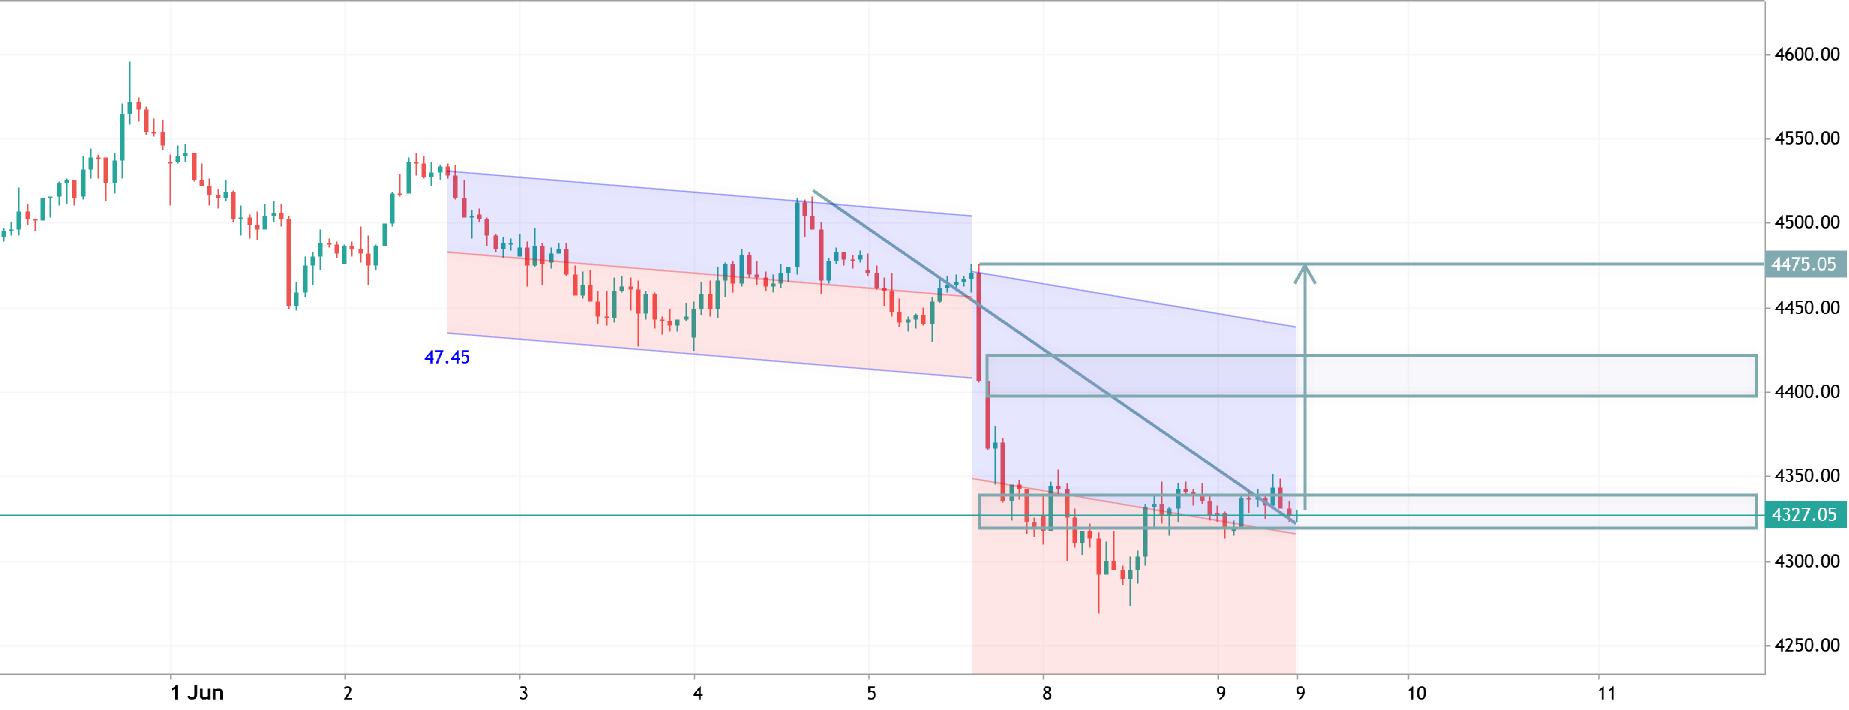
🟢 XAU/USD Buy Signal Buy Zone: 4404 – 4394 Stop Loss: 4380 Take Profit 1: 4415 Take Profit 2: 4430 Take Profit 3: 4450 📈 Gold is approaching the 4404–4394 buy zone, which could provide a favorable area for a day-trade buy. If price holds this zone and shows bullish confirmation, Gold could continue higher toward 4415, followed by 4430 and 4450. Consider securing partial profits at TP1 and TP2 while allowing the remaining position to target TP3. Proper risk management and disciplined execution remain essential. Risk Disclaimer: Trading forex and commodities involves substantial risk. Always use proper risk management and never risk more than you can afford to lose.
Gold Reversal Roadmap XAUUSD Long Gold vs US Dollar

Gold Reversal Roadmap

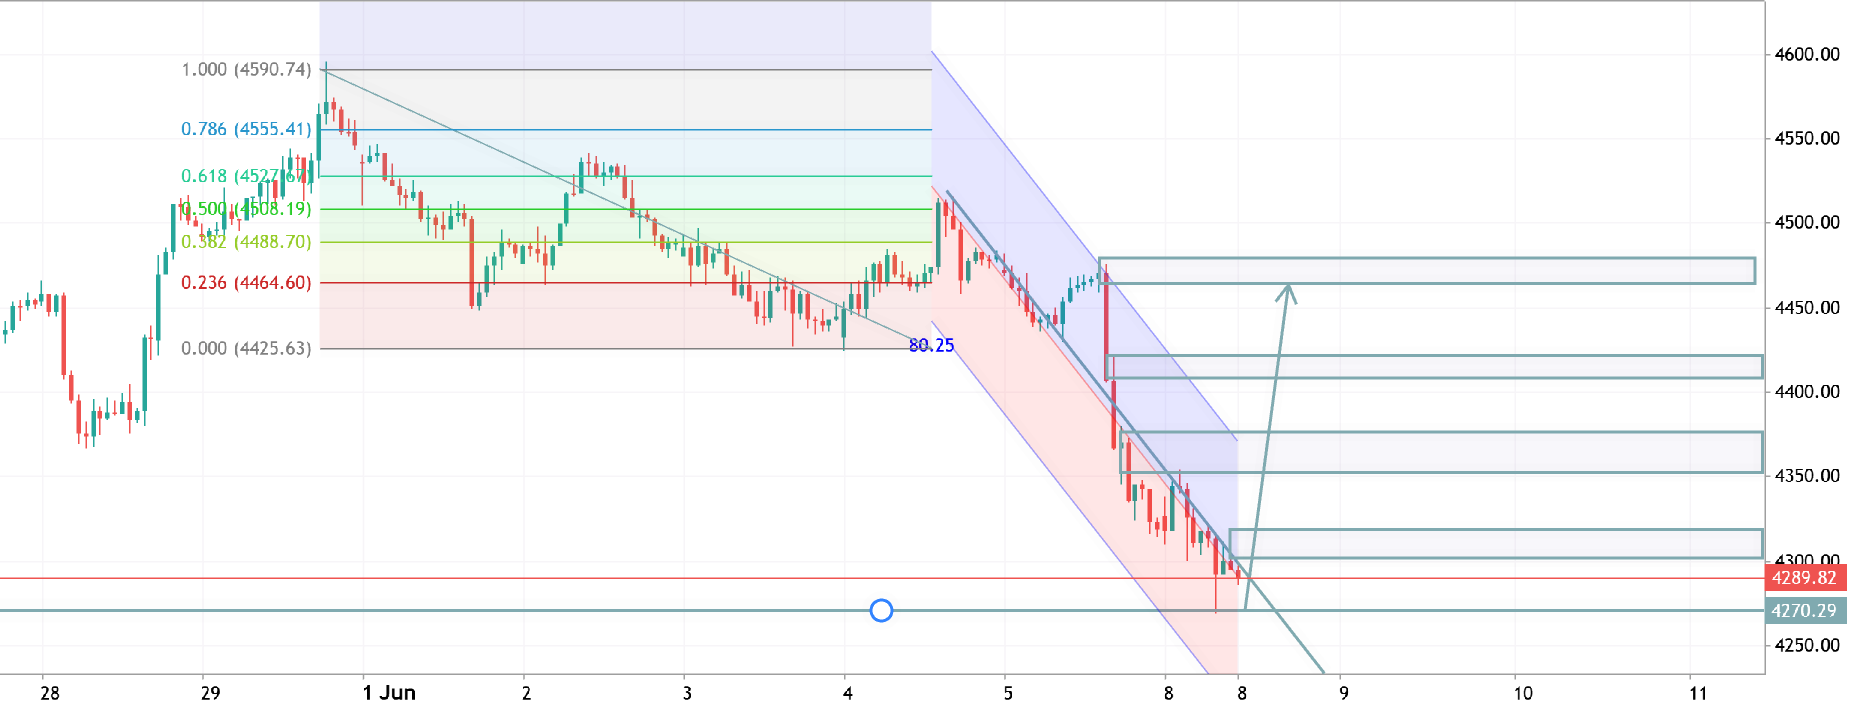
Gold ran hard from about 4000 in late July to a peak near 4690 on Aug 25. Since that top, every rally has failed a little lower than the last — that's the downward-sloping line drawn from the high. Meanwhile the lows around 4280–4300 (mid-August and the Sep 1–3 dip) have held, forming the flat-ish line underneath. Price is now squeezed into the narrowing gap between them, which is why the last two weeks look choppy and directionless. R oadmap: One more leg down. Price slides along under the falling resistance line and drops into the 4280–4300 support zone, roughly mid-September. Notice the up-arrow actually starts below the support line, near 4260 — so the idea allows for a brief dip through support (a stop-run) before it turns. First bounce. A recovery to around 4450, then a pullback to
AMZN: $252 support and a $261 breakout trigger AMZN Amazon.com, Inc. - Common Stock

AMZN: $252 support and a $261 breakout trigger

Amazon (NASDAQ: AMZN) | Daily chart | September 9, 2026 View: neutral while the base develops; bullish only after confirmation. Horizon: 2–6 weeks. The latest completed regular session, September 8, closed at $256.97, down 0.60%. This analysis uses that close. Price structure The daily chart shows a pullback from the July peak, with price now testing a potential base. Support sits at $254.75 (September 8 low), followed by $253.40 and $251.93 (September 2 and September 1 lows). Resistance is $259.50–261.12, then $264.36 and $267.56, the August 31 and August 28 highs. These are areas to watch, not guaranteed turning points. Preferred bullish setup Wait for a daily close above $261.20, ideally on volume above its 20-session average, then a successful retest of $260.50–261.50. A retest that
XTIUSD (Crude Oil) – 95.5 Sell Setup XTIUSD Short Crude Oil vs US Dollar

XTIUSD (Crude Oil) – 95.5 Sell Setup

📉 Sell Zone: 95.5 – 95.8 🛑 Stop Loss: 96.0 🎯 Target: • TP1: 93.0 📈 Market View: Crude Oil is approaching the 95.5–95.8 resistance zone. If sellers defend this area and price remains below 96.0, bearish pressure could drive XTI/USD toward the 93.0 support level. 📌 Trade Management: Once price moves in your favor, consider protecting the position and managing risk accordingly. ⚠️ Risk Disclaimer: This is a technical analysis setup, not a guarantee of profit. Always use proper risk management.