XAUUSD TRADE IDEA XAUUSD Long Gold vs US Dollar

XAUUSD TRADE IDEA

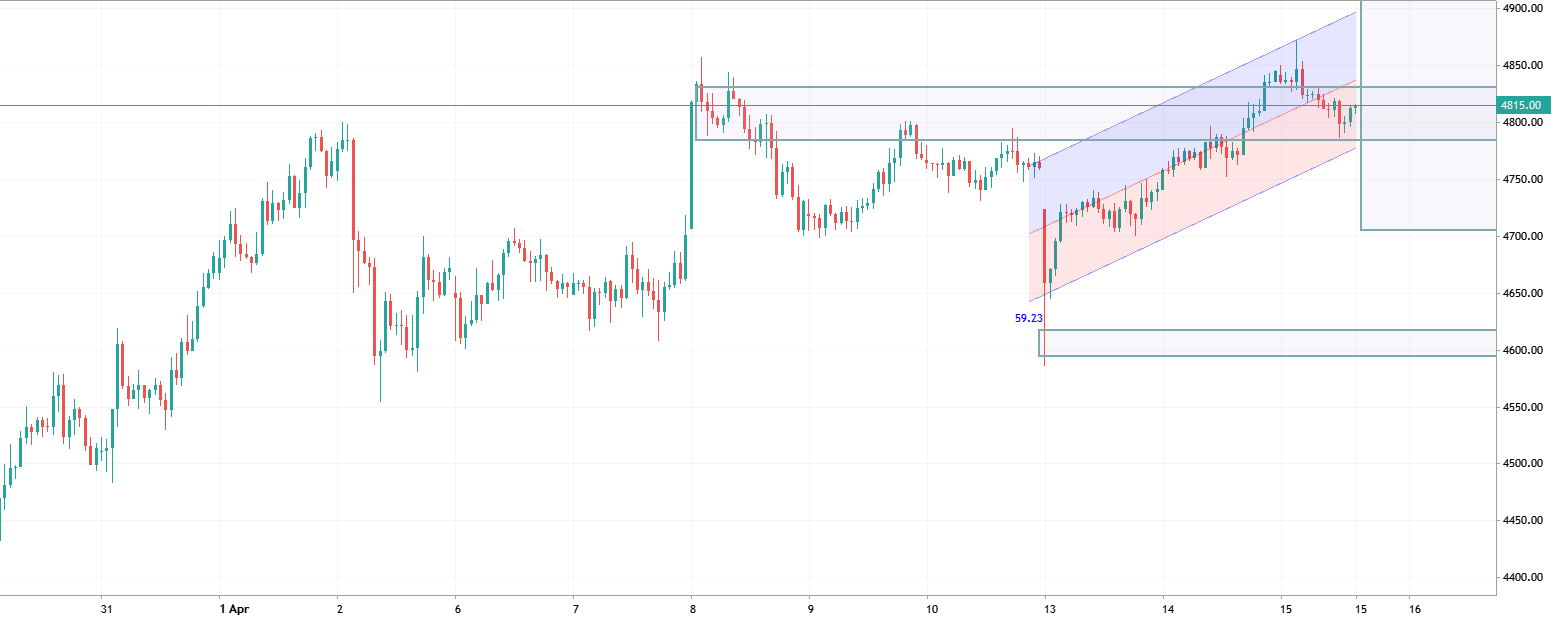
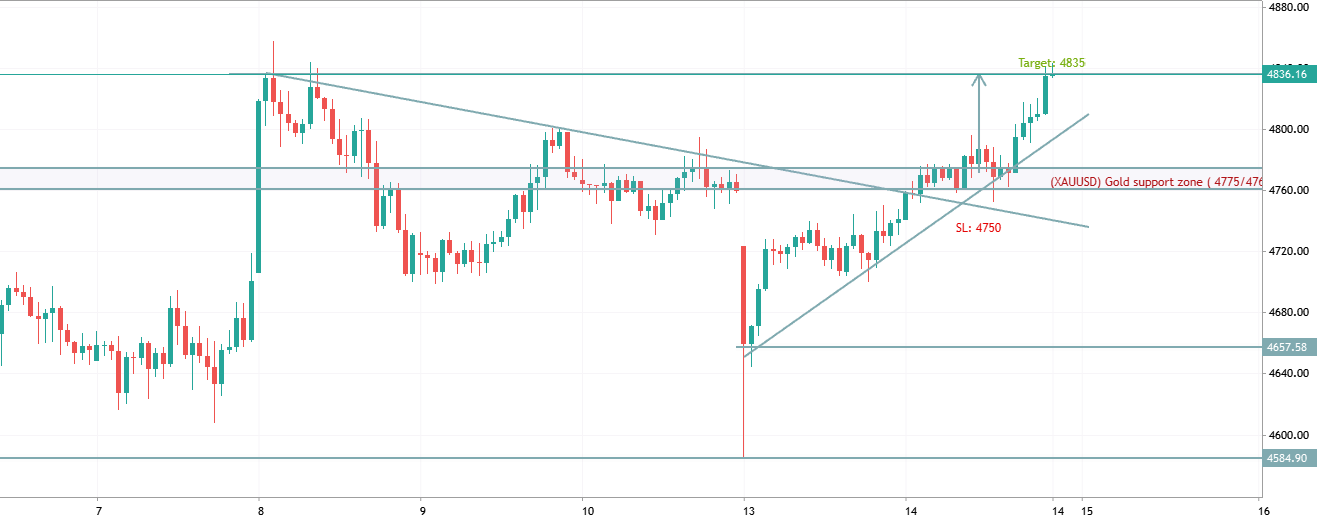
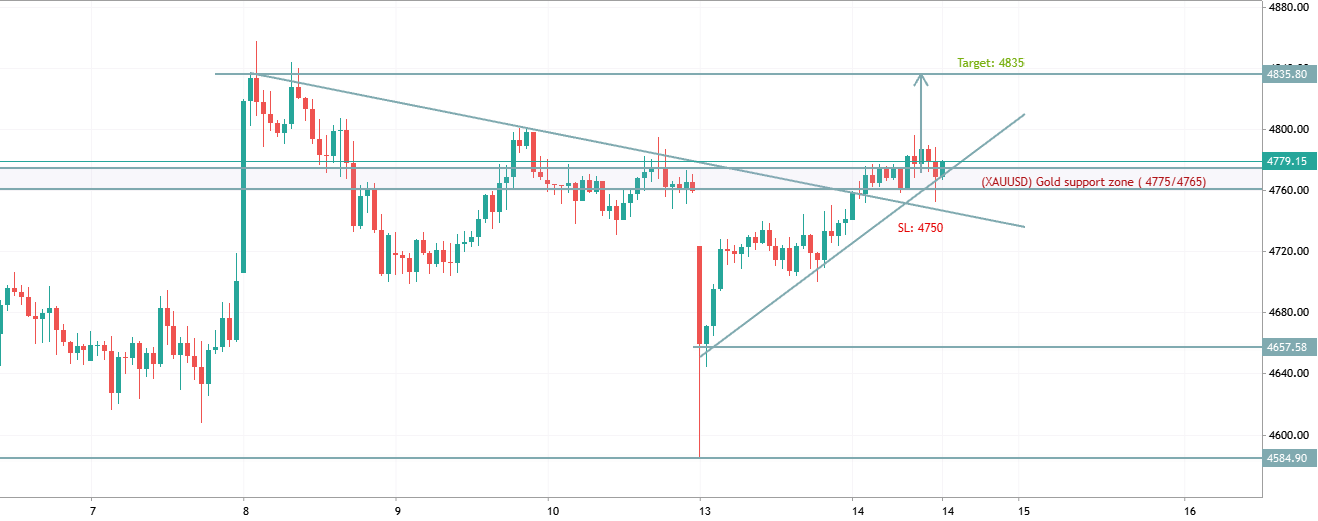
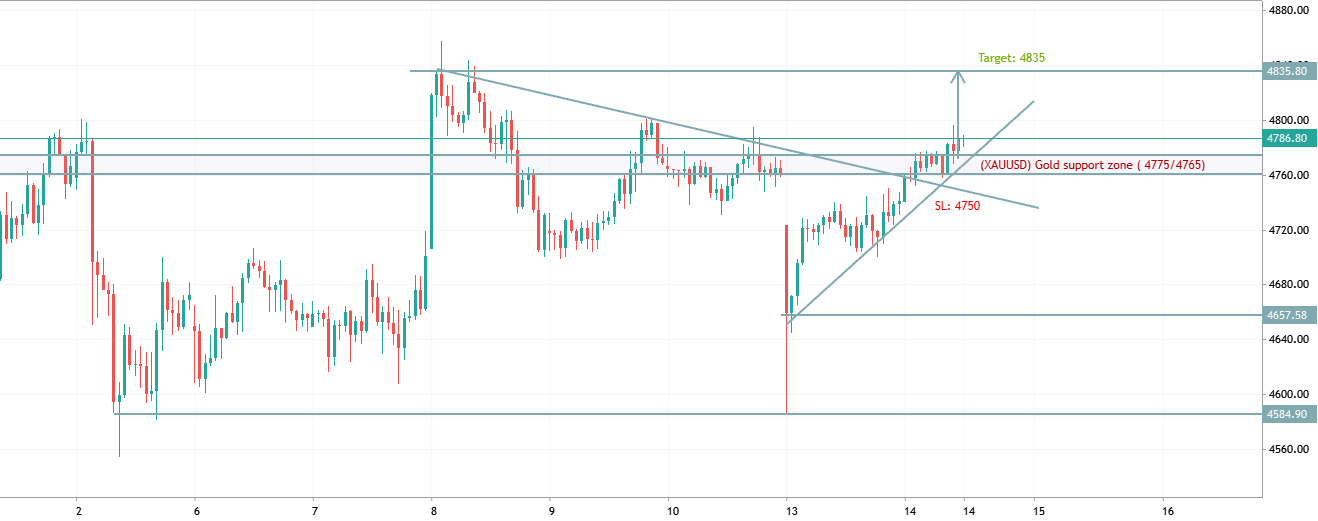
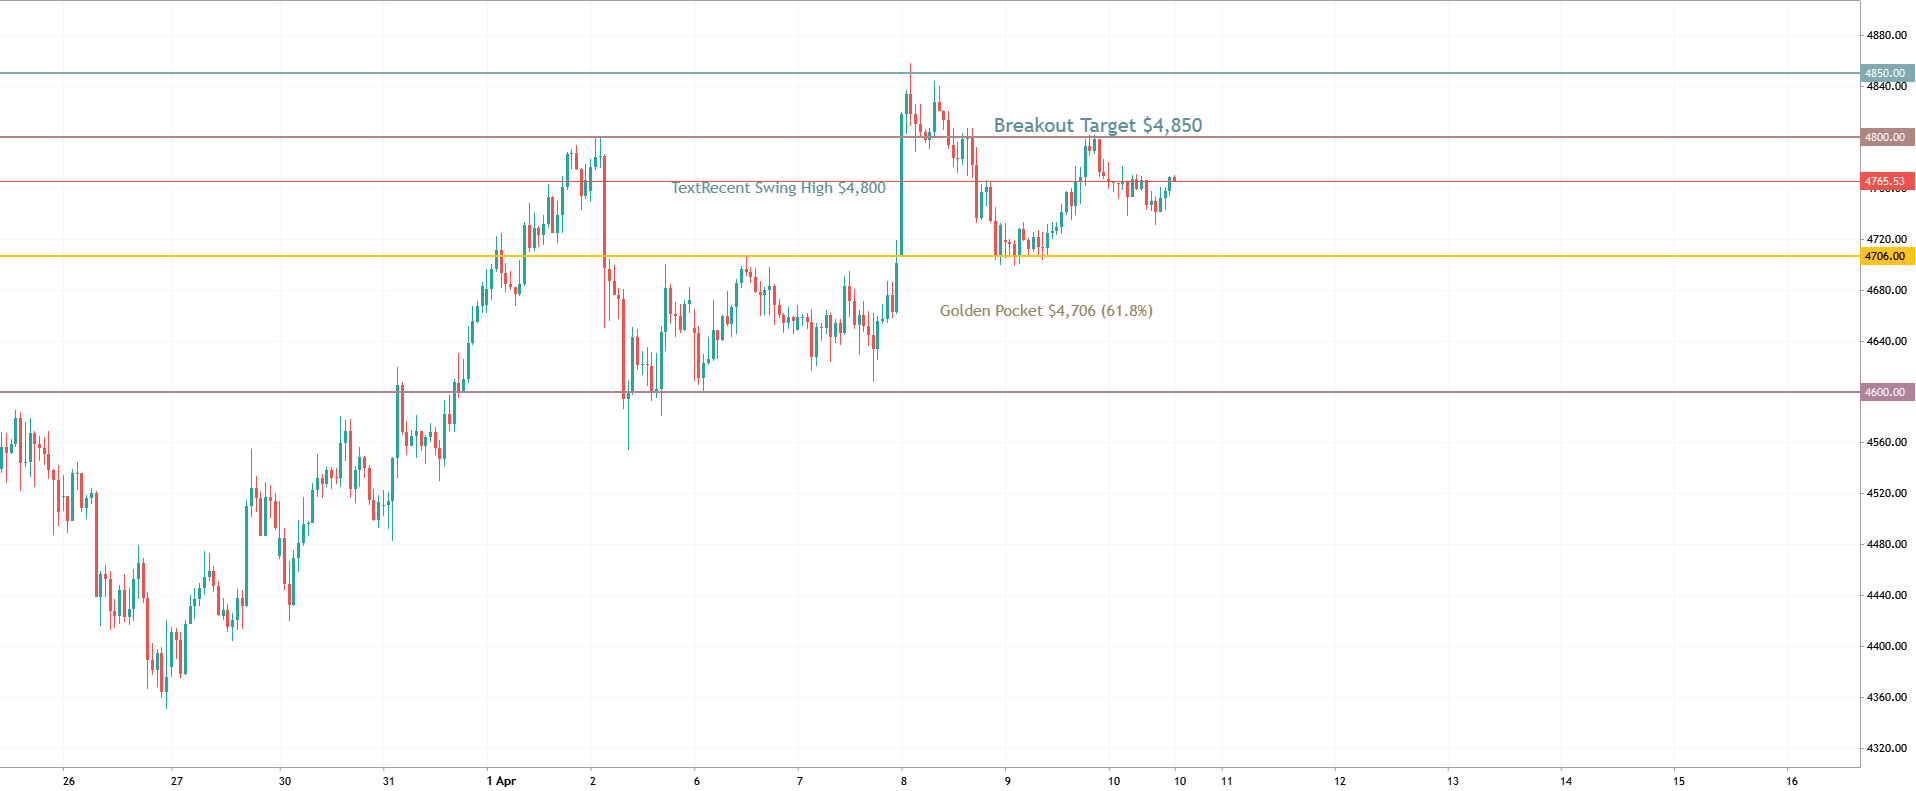
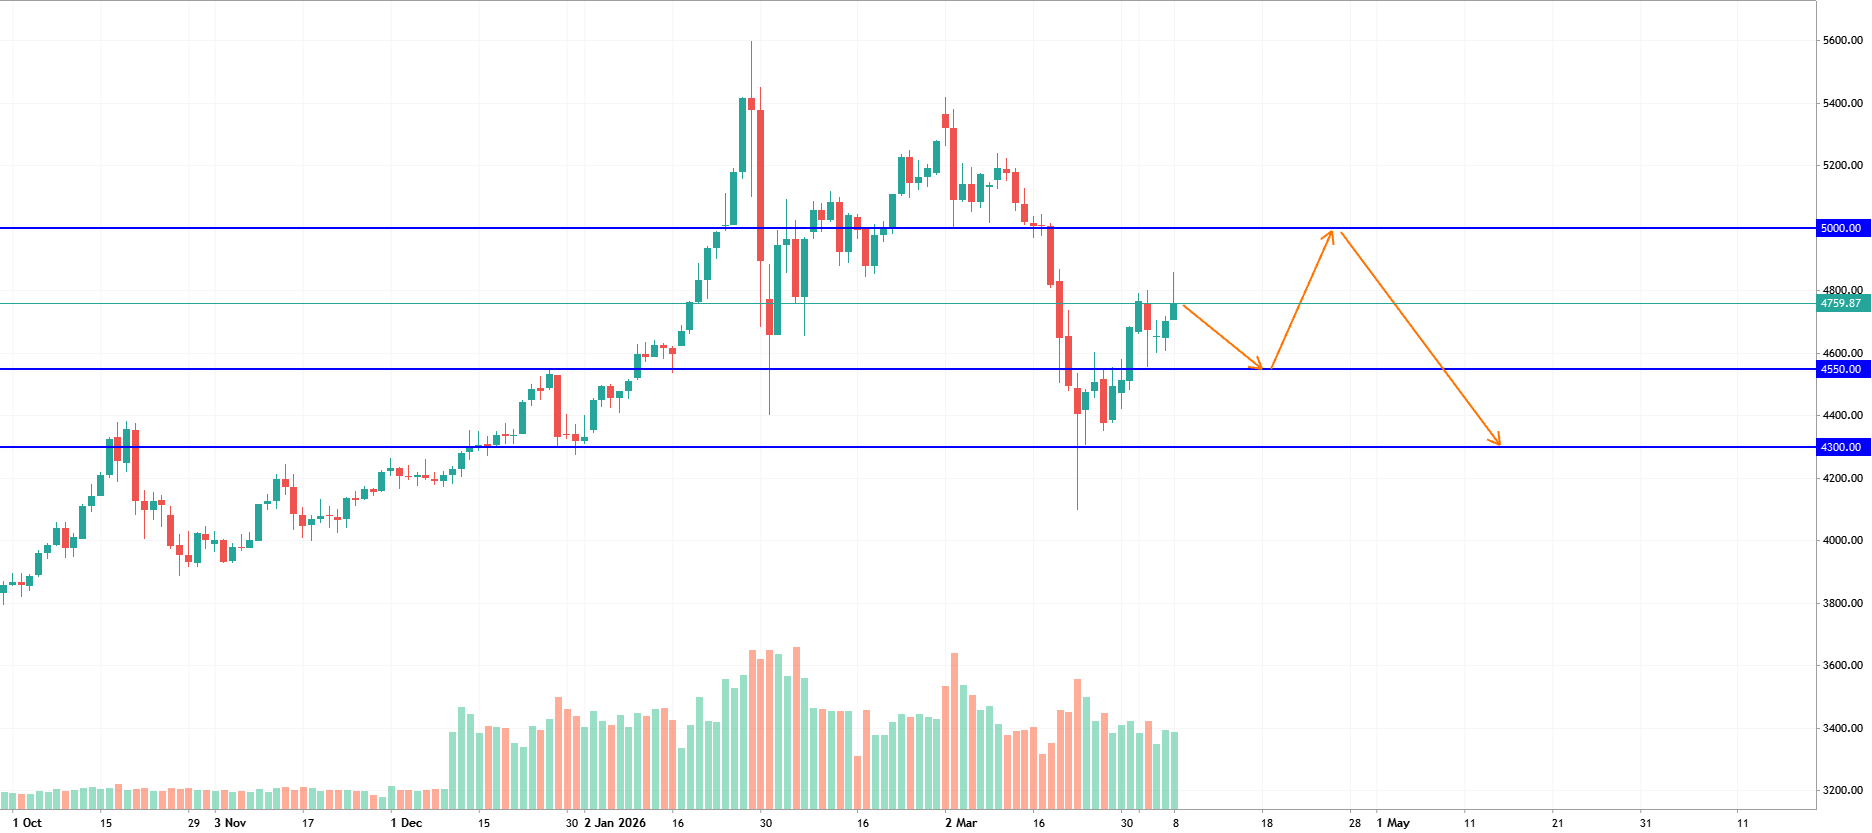
The market remains in a short-term bullish structure after forming higher lows inside the ascending channel. Price recently rejected the 4653 support zone and pushed back toward the key resistance area around 4752. However, momentum is weakening near resistance, and the latest rejection candle suggests buyers are struggling to maintain control above 4700. A confirmed break below the channel support and 4653 could trigger a deeper correction toward 4600–4560. On the bullish side, holding above 4653 keeps the upward structure valid, with a potential retest of 4752 and possibly 4800 if resistance breaks decisively. Current bias: cautiously bullish above 4653, bearish below channel support.
XAUUSD M15 — Long Setup | 12 May 2026 XAUUSD Long Gold vs US Dollar

XAUUSD M15 — Long Setup | 12 May 2026

Key support structure — Prior horizontal support from pre-surge base (~4689–4703) held multiple touches, confirming it as a structural demand zone.Price has pulled back sharply from the 4768 swing high, clearing out weak longs and sweeping liquidity down into a confluent demand zone sitting between  4689.91 and 4702.65 . This area aligns with a clearly marked key support structure on the chart — a level that previously launched the sharp bullish expansion earlier in the session — further reinforced by an M5 hidden demand zone sitting directly on top of it. The thesis is simple: smart money has accumulated, retail stops have been collected, and price is now positioned to reclaim higher ground. We are looking for a bullish M5 confirmation candle (engulfing or pin bar) before
XAUUSD Institutional Setup: Buy-Side Sweep & CRT Reversal (Tuesday Manipulation) XAUUSD Short Gold vs US Dollar

XAUUSD Institutional Setup: Buy-Side Sweep & CRT Reversal (Tuesday Manipulation)

Macro Context & Liquidity Profile: Gold (XAUUSD) has printed a classic Institutional Weekly Profile. Following accumulation, we are witnessing the textbook "Tuesday Manipulation" phase. The algorithmic pricing engine has intentionally driven the price higher to engineer liquidity above the previous structural highs. The Setup (The Sweep): Notice the aggressive push upwards. This is a deliberate Buy-Side Liquidity (BSL) sweep. Retail breakout traders are being trapped into long positions, while early shorters are being stopped out. This creates the perfect counter-party liquidity pool for institutional sell orders. The Trigger (CRT Confirmation): The validation of this sweep is the CRT (Close Reversal Trade / Candle Reversal) forming right at the high. The immediate rejection and
XAUUSD (Gold) Analysis XAUUSD Short Gold vs US Dollar

XAUUSD (Gold) Analysis

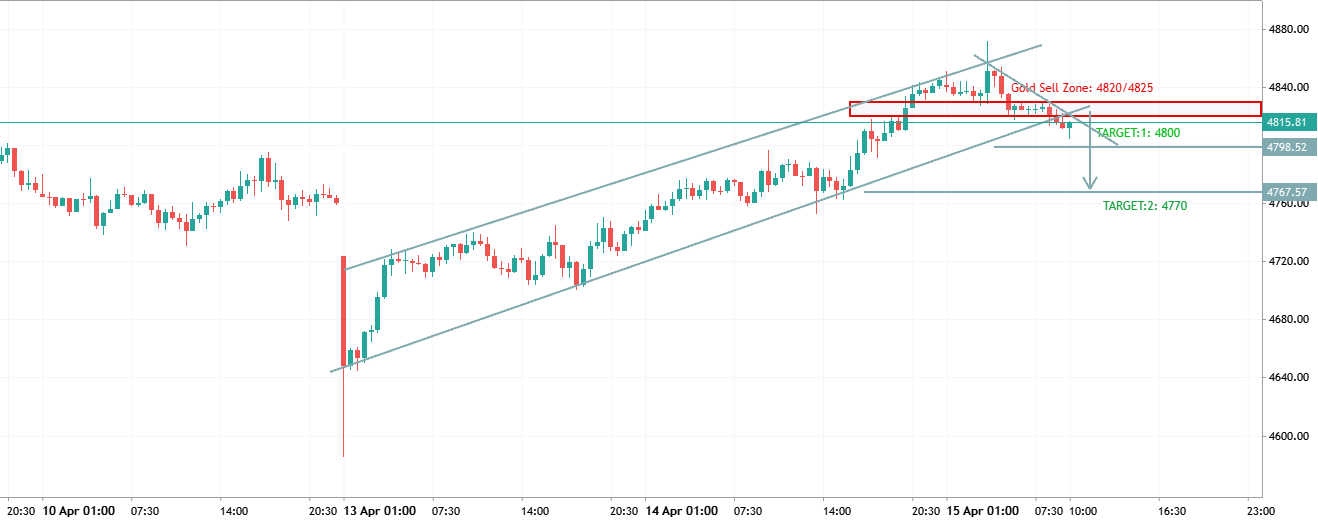
XAUUSD (Gold) Analysis Gold is currently trading inside a corrective structure after taking liquidity from the highs near the MSS zone. Price rejected from the FVG / supply area around 4740-equivalent zone on your chart and is now sitting near key support. Bearish Scenario: • Break & close below support zone • Momentum continuation toward the OB demand below • Liquidity sweep already taken from highs Target 1: Internal liquidity lows Target 2: OB zone below Final target: Full imbalance fill Bullish Scenario: If support holds and buyers reclaim the FVG zone, gold can push back toward recent highs. Right now this looks more like: “retest → reaction → then directional move” rather than immediate trend continuation https://www.mql5.com/en/users/xking05
GBPUSD TRADE IDEA GBPUSD Long Pound Sterling vs US Dollar

GBPUSD TRADE IDEA

GBP/USD is maintaining a bullish structure on the H4 timeframe, trading within a well-defined ascending channel after a strong rebound from the 1.3460 support zone. Price action continues to form higher lows, indicating sustained buying momentum despite short-term consolidation near resistance. The pair is currently testing the 1.3610–1.3630 resistance area. A confirmed breakout above this zone could trigger further upside toward 1.3650 and potentially 1.3680. Momentum remains constructive as long as price stays above the ascending trendline support. Immediate support is located at 1.3585, followed by 1.3550. A pullback into these areas may attract fresh buyers and preserve the bullish continuation setup. However, a breakdown below the channel structure would weaken the bullish outlook and
eurusd h1 analysis EURUSD Euro vs US Dollar

eurusd h1 analysis

EUROUSD H1 ANALYSIS *Option 1: Technical breakdown* - *Pair/TF*: EURUSD H1 - *Structure*: Price rejected from 1.17864 supply and now retesting broken 1.17600 level. Box shows consolidation between 1.17465 - 1.17860. - *Bias*: Bearish below 1.17600 with arrow targeting 1.17165 support. Break above 1.17864 invalidates. - *Play*: Waiting for H1 close below 1.17465 to confirm momentum toward 1.17165 - 1.17000 demand zone. *Option 2: Clean & confident* EURUSD H1 | Range to impulse setup Price compressed in 40pip box after liquidity sweep at 1.17864. Clean break + retest of 1.17600 flips it to resistance. Targeting weekly low at 1.17165. No longs until 1.17864 reclaimed with volume. Managing risk first, profits second. *Option 3: Short & punchy* H1 EURUSD at decision point. Failed to
BTCUSD ANALYSIS BTCUSD Long Bitcoin vs US Dollar

BTCUSD ANALYSIS

BTCUSD ANALYSIS ₿ BTC is currently showing a bullish market structure, while forming a potential Bullish Flag / Pennant pattern in the short term. After a strong impulsive rally, price has entered a consolidation phase around the 80.8k - 81k zone, which often signals continuation if buyers remain in control. Bullish Confirmation: • Break & close above the 81,500 – 82,000 resistance zone • Strong momentum and volume continuation Target 1: 82,500 Target 2: 83,000+ Invalidation: If BTC closes strongly below the 80k support zone, the bullish setup weakens and a deeper pullback may follow. Key Observations: • Higher lows are still being respected • Market structure remains bullish overall • Current movement looks more like consolidation than reversal In simple terms: Break above 81k =