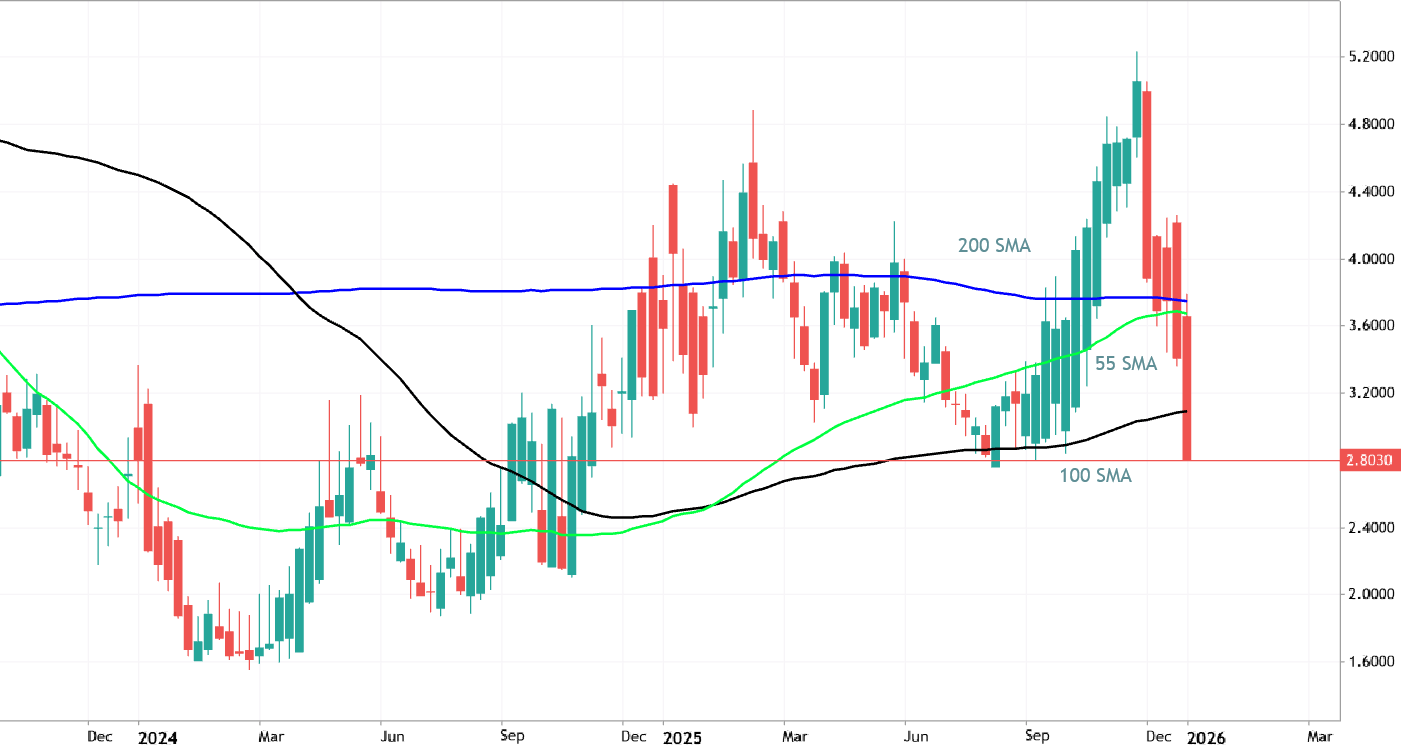
200 SMA: the most easy way to estimate the trend - part #2 (secondary trend)
Once we know about how to estimate the primary trend (the price to be above/below 200 SMA for example) so we can estimate the secondary trend of it by looking at the other two SMA indicators: 55 SMA (as the fast one) and 100 SMA (as the medium/slow one). The secondary trend (correction and bear market rally) can be received by the combination of those two indicator. On the chart above: the price broke 200 SMA to below for the primary bearish reversal but fast SMA (55 SMA) crossed 100 SMA to above for the bear market rally in the near future for example.
0 