BTC BREAKOUT UPDATE BTCUSD Bitcoin vs US Dollar

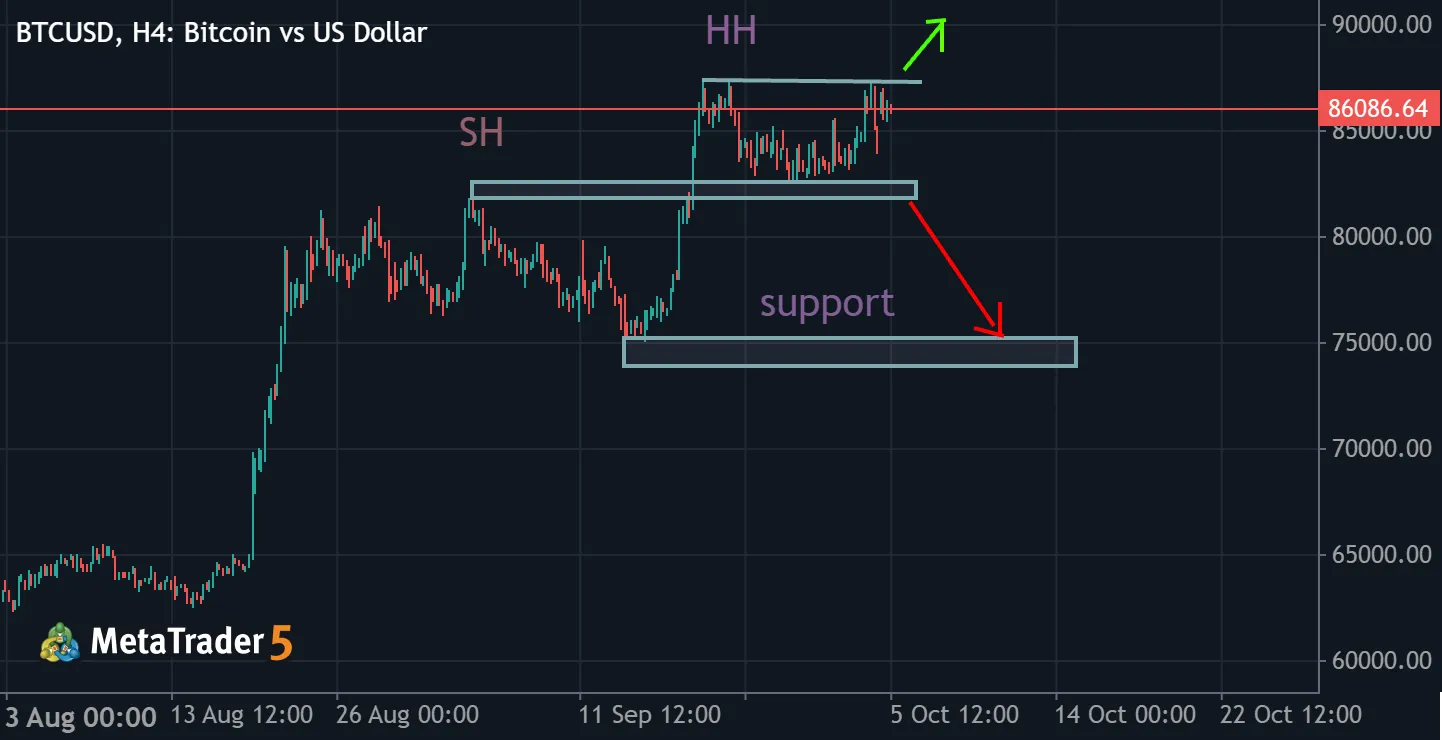
BTC BREAKOUT UPDATE

Price scale: The scale is clear (gridlines every 2,500, current price 85,931). All levels below are read off the chart, so treat them as approximate zones, not exact prints. This is the 4h timeframe only, and no volume or oscillator data is visible (the CRT indicator is hidden). Key zones Resistance ~87,000-87,500 (strongest): the Sep 22-23 high and the Oct 3 high stopped at nearly the same spot, so it has been rejected twice. ~81,500-82,300: the early-September swing high (wick to ~82.3k). Price broke through it in the Sep 21-22 rally, so it is now more likely support than resistance. Support ~82,500-83,500 (strongest): the floor of the current range, touched repeatedly from late Sep to early Oct. ~83,800: the most recent pullback wick low on Oct 3-4, the nearest minor support. ~75,000

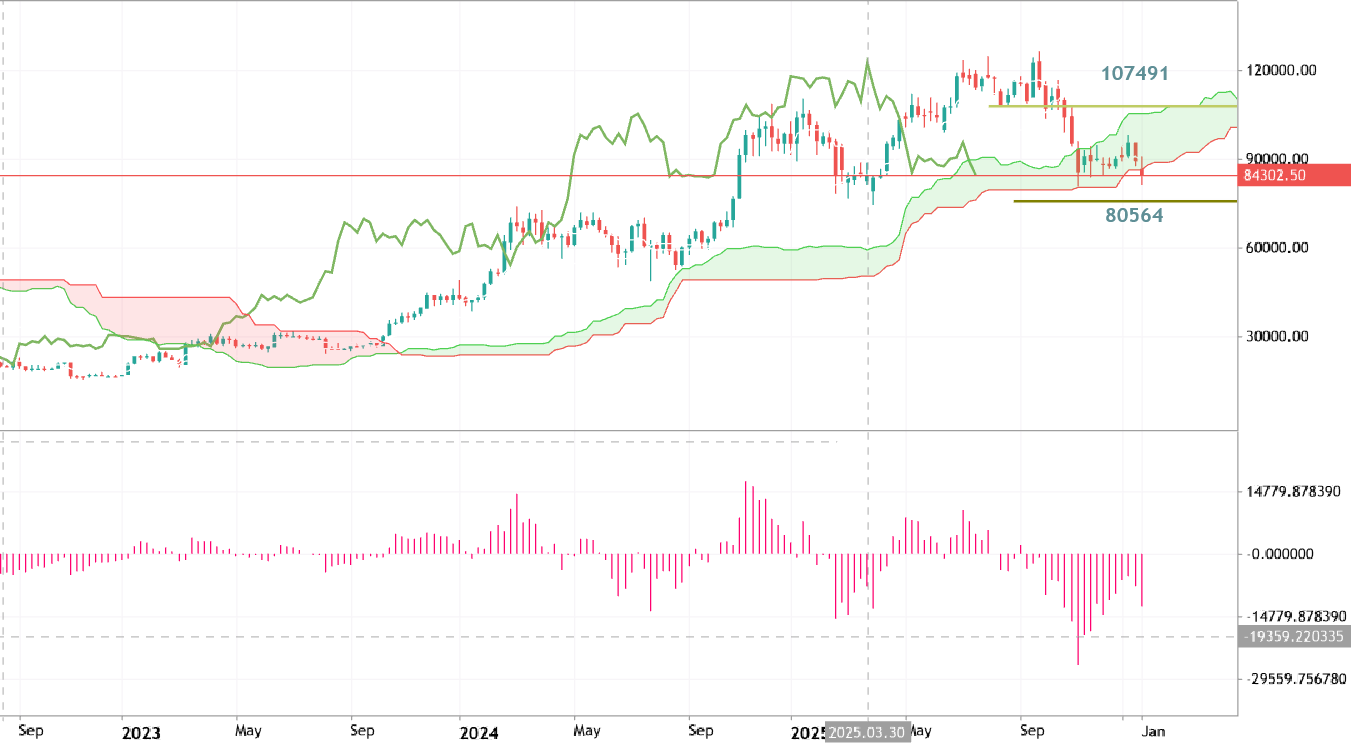
Bears Power - traditional general approach BTCUSD Bitcoin vs US Dollar

Bears Power - traditional general approach

Bears Power is used to estimate power of the Bears (Sellers). Bears Power estimates the balance of power between the bulls and bears. This indicator aims at identifying if a bearish trend will continue or if the price has reached a point where it might reverse. A sell signal is generated when the oscillator moves below Zero. In a down trend, the LOW is lower than EMA, so the Indicator is below zero and Histogram/Oscillator is located below zero line. Exit Signal: if the LOW moves above the EMA then it means that price are starting to rise, the Indicator histogram rises above the zero line.
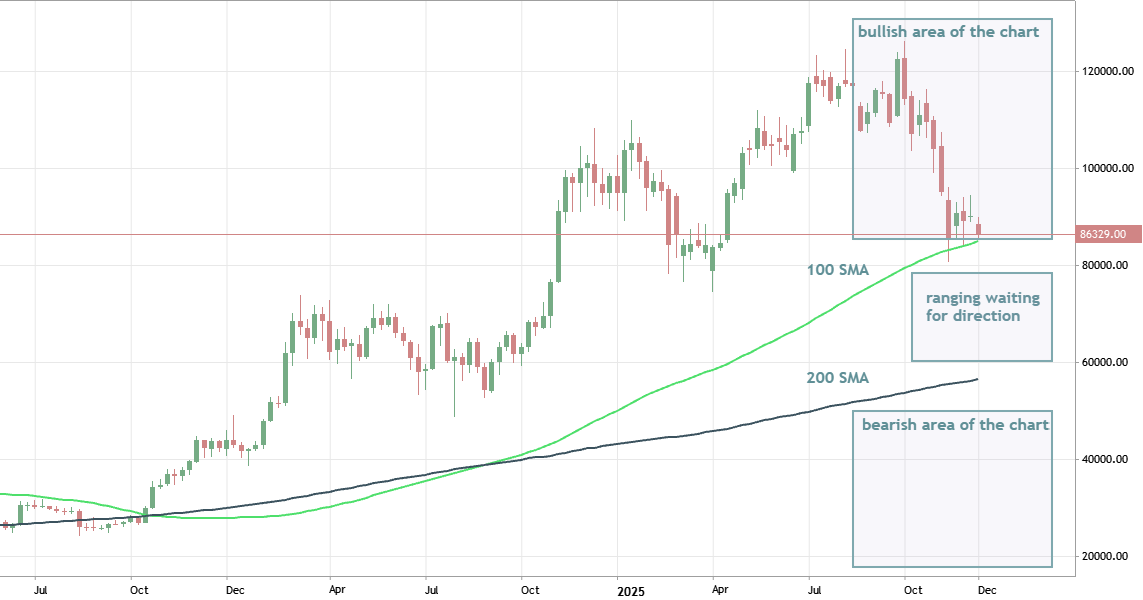
Market condition evaluation by using two SMA indicators BTCUSD Bitcoin vs US Dollar

Market condition evaluation by using two SMA indicators

One of the main problem for the traders is about how to estimate the Market condition in simple (but effective) way. And this moethod is really great: just plot two SMA indicators with the period of 100 and 200, and after that - look at the chart: if those two indicator is on uptrend and the price is above the two indicator so it is primary bullish market condition; opposite - for bearish trend. But if the price is located between those two indicator so it is secondary ranging condition, means: waiting for direction. It is really simply but effective method to estimate the market condition in the beginning of the trading session for example.