


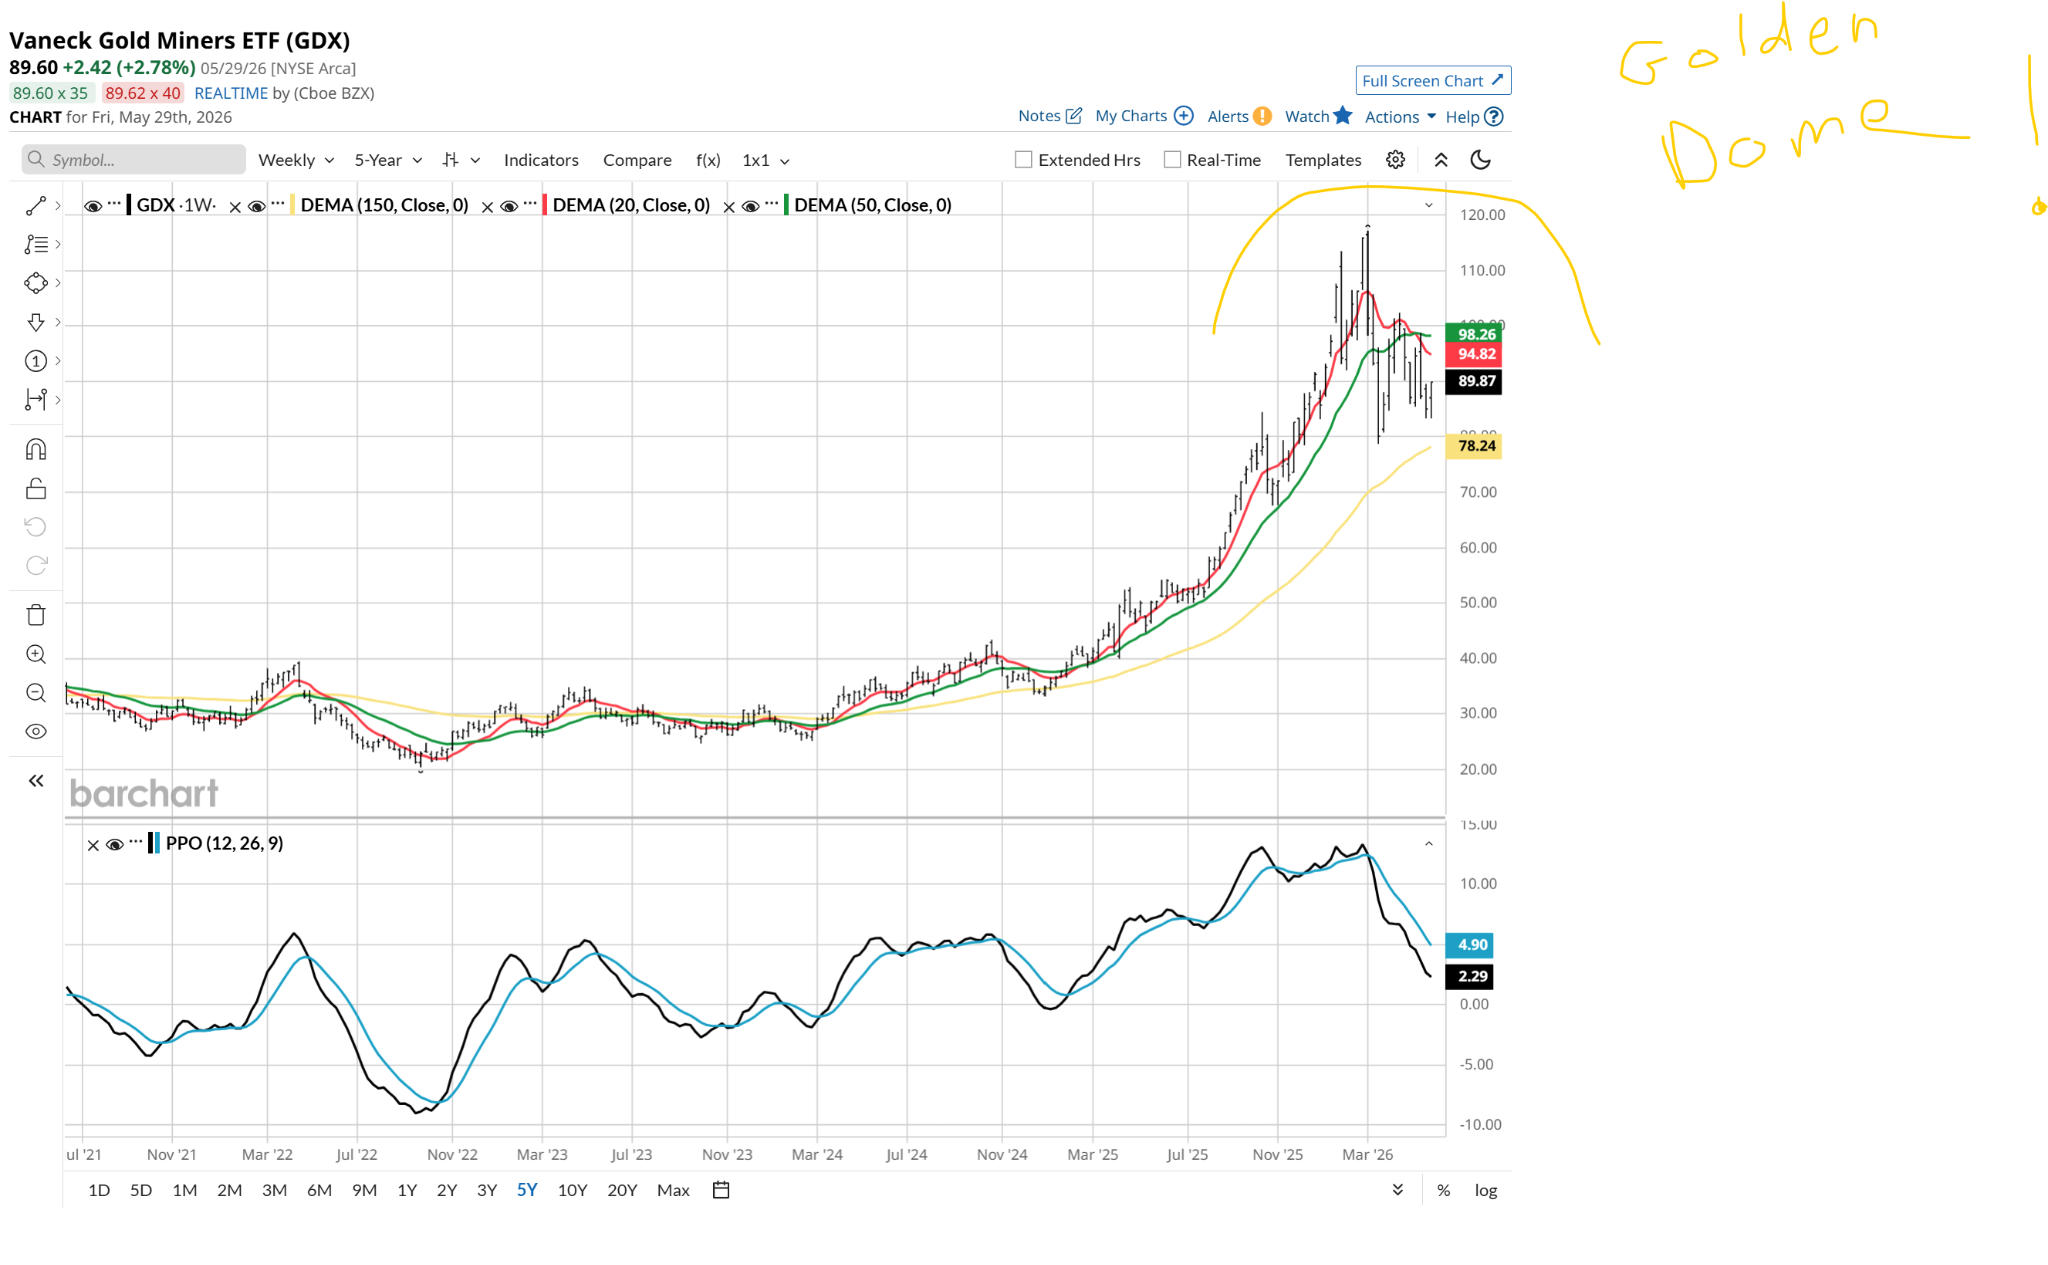
I saw this chart of the VanEck Gold Miners ETF (GDX) and my first thought was “golden dome.” The same name President Donald Trump plans to apply to a new defense system, similar to that which has protected Israel for over a decade.
So I scribbled that name on the weekly chart shown below. Beyond the rounded top, the percentage price oscillator (PPO) indicator at the bottom looks very weak.
Don’t Miss a Day: From crude oil to coffee, sign up free for Barchart’s best-in-class commodity analysis.
 www.barchart.com
 So I decided to look at the GDX ETF in two more time frames, daily and monthly. My conclusion: There is a time to run with the bulls, and there is a time to recognize when the bulls have completely exhausted their runway.
The parabolic melt-up in GDX was a magnificent spectacle. It more than quadrupled between March 2025 and March 2026. But the technical and behavioral evidence is now signaling that the best days of this trade are firmly in the rearview mirror.
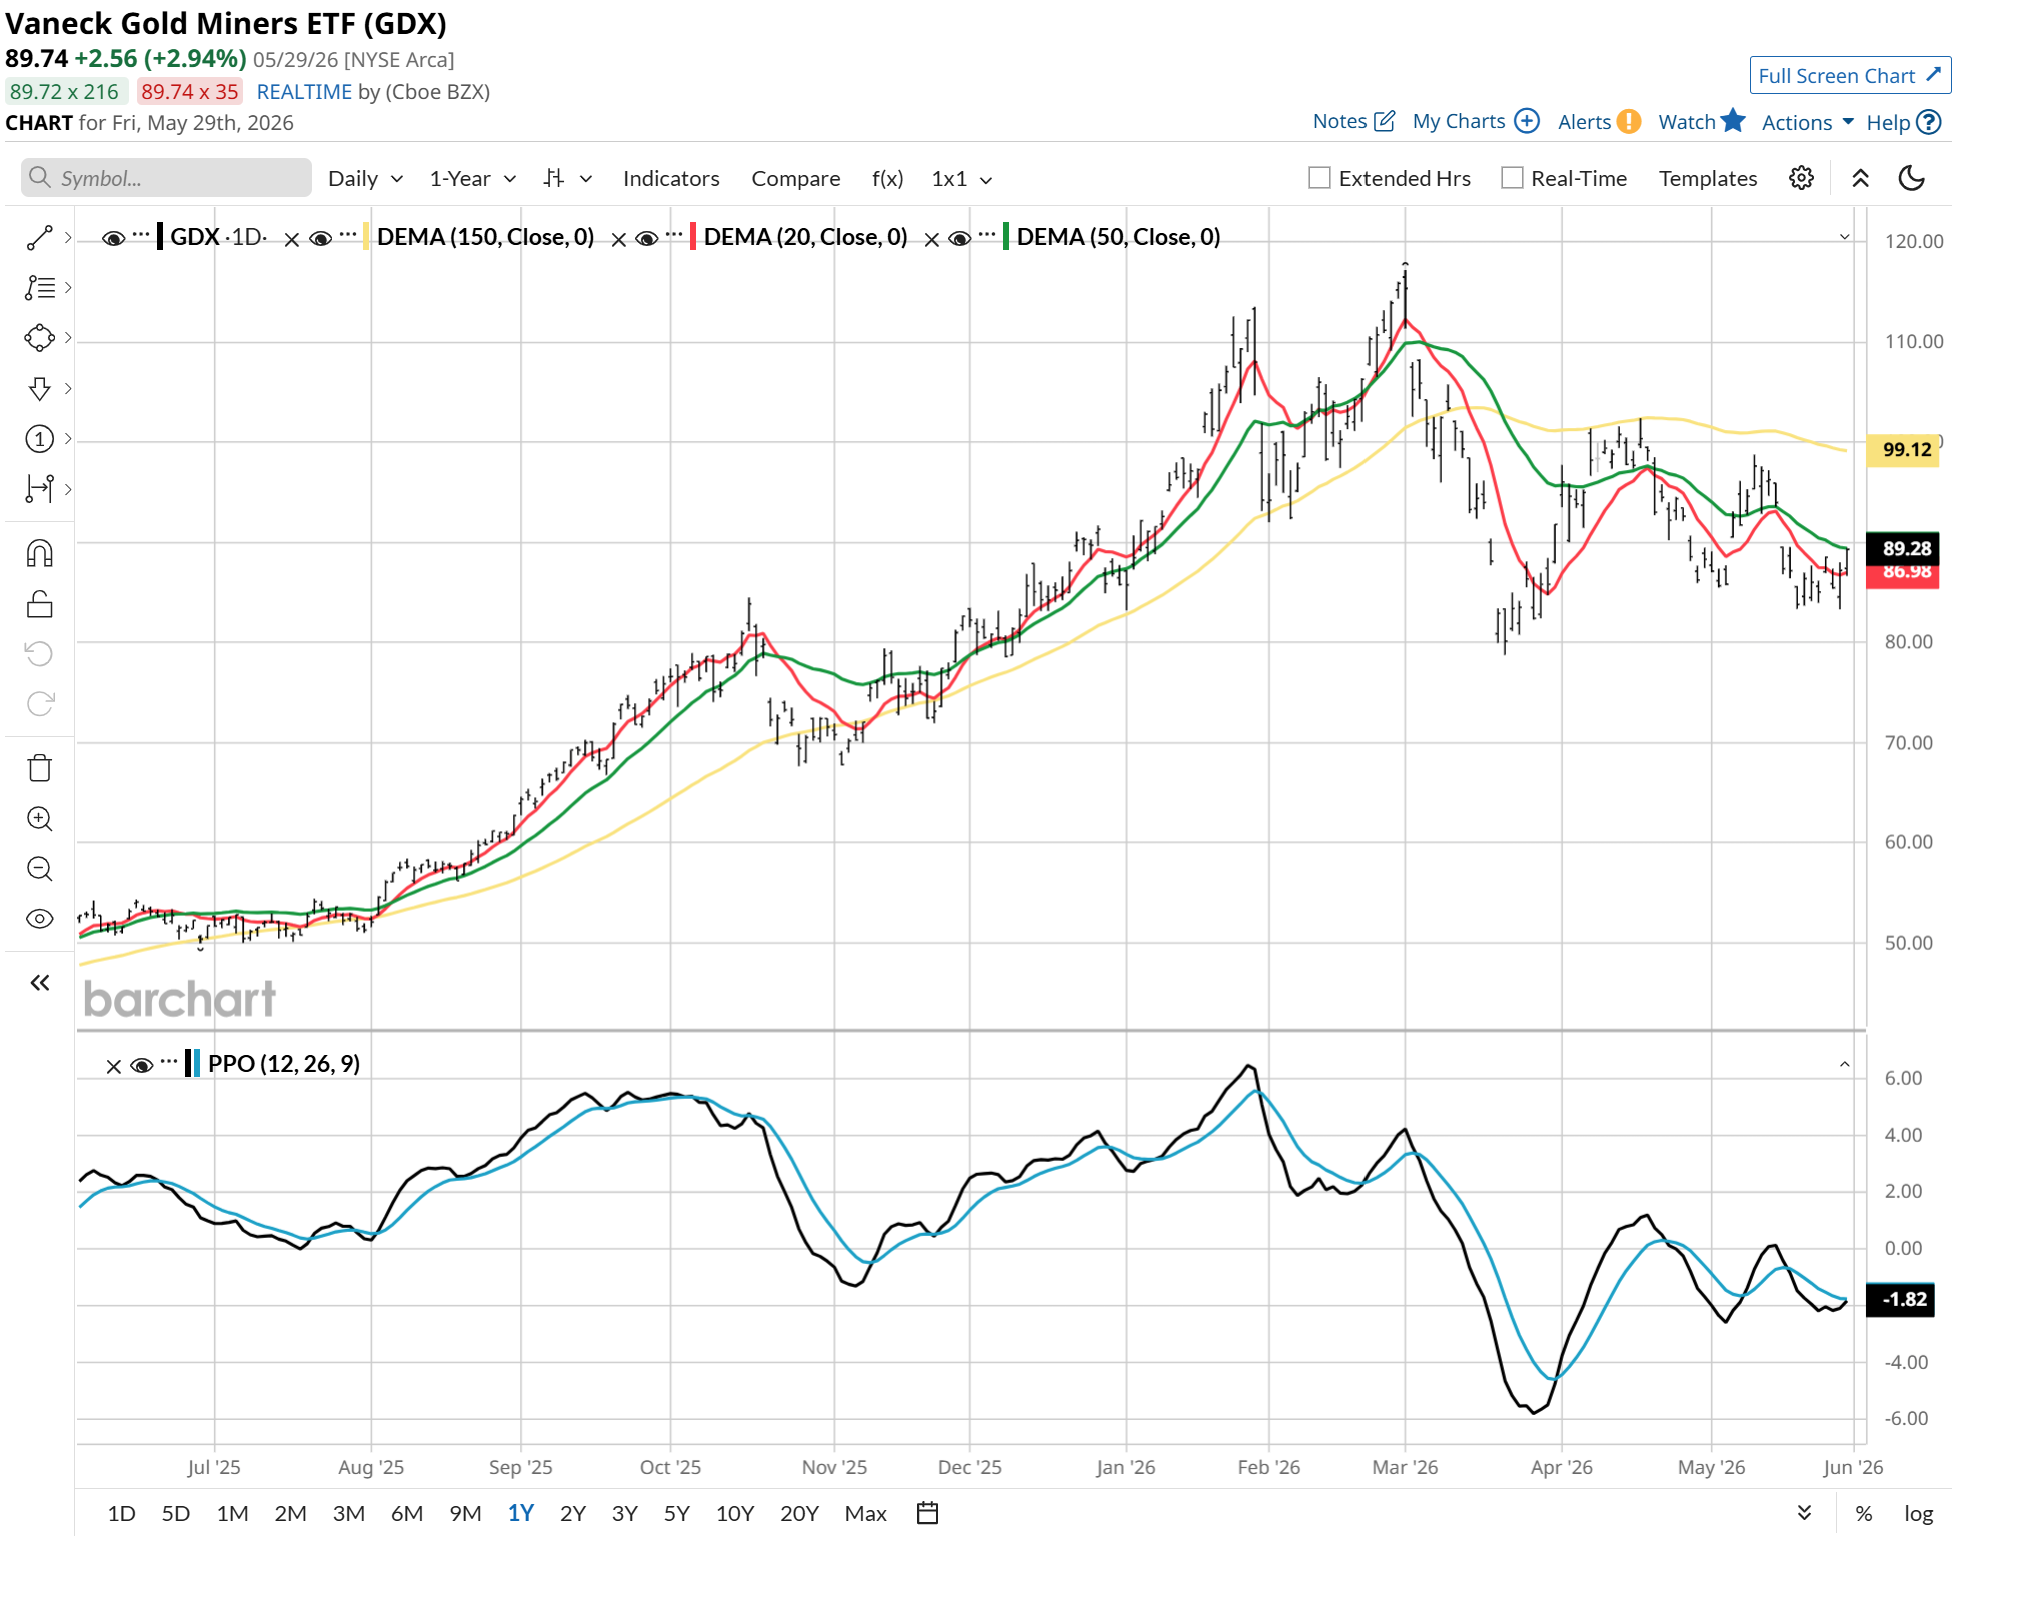
Here’s the daily chart. Yes, there could still be some upside left, fleeting as it may be. Again, daily charts are great for trading, but without the weekly backup, it is trading-only to me. The 20-day moving average could rise again, and GDX could run up another 10%-20% or so. A good trade. But beyond that, it looks murky at best.
 www.barchart.com
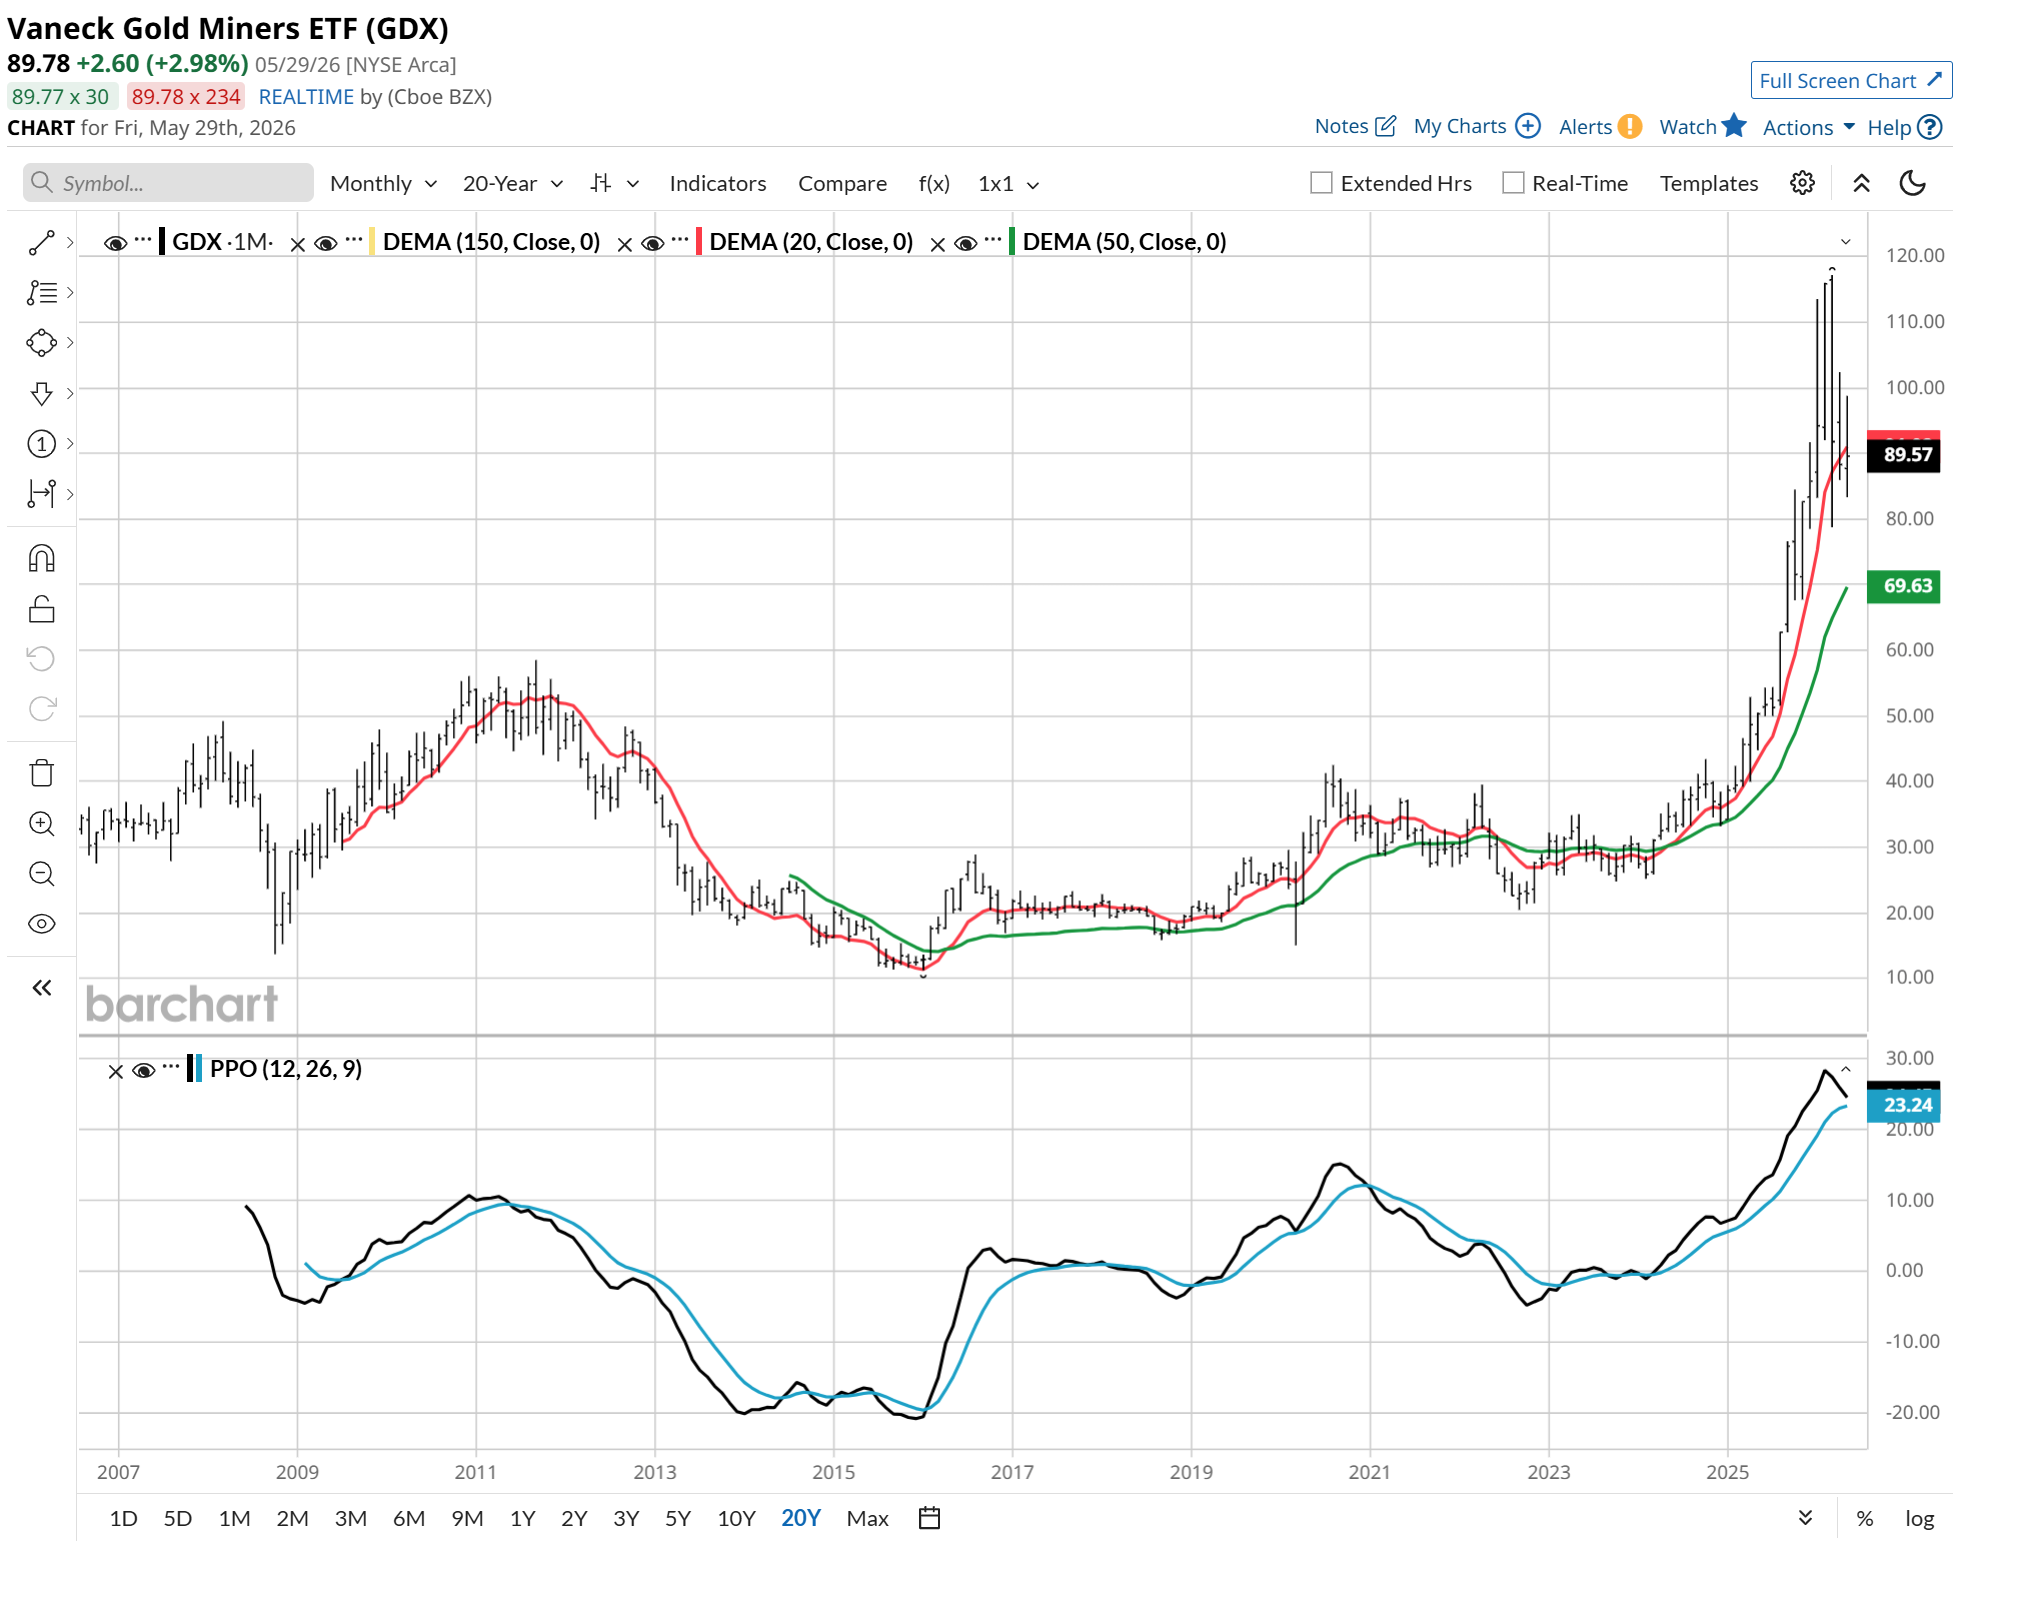
 I’ve shown you the weekly and the daily. Let’s complete the charting triumvirate with the monthly view.
As soon below, it’s this chart that breaks the time for me as it leans bearish longer term. Why? The PPO again. That indicator is high and preparing to roll over. That’s a month per bar, so it will take some months to form and cross over to the downside. Then, it’s “game on” for GDX bears.
 www.barchart.com
 For disciplined investors who refuse to buy a collapsing chart, the diagnosis is simple: GDX has transitioned from a structural bull run into a classic, distribution-heavy asset class where the path of least resistance points down. When an ETF undergoes a vertical thrust of that magnitude, it requires a constant, escalating influx of new capital to sustain its altitude. The moment that momentum hesitates, the floor falls out. And only a news event out of left field can save it. That’s always a possibility.
This ROAR Score view shows the recent evolution nicely. $105 as of 60 days ago, just one week after GDX topped out around $118. Then a downgrade from lower risk to average risk (yellow: 40) as of April 1.
Since that time, the ROAR Score has waffled between yellow and red (higher risk zone). That’s “only” about a 16% pullback in three months, but it documents the turn from intermediate bullish to intermediate bearish in my view.
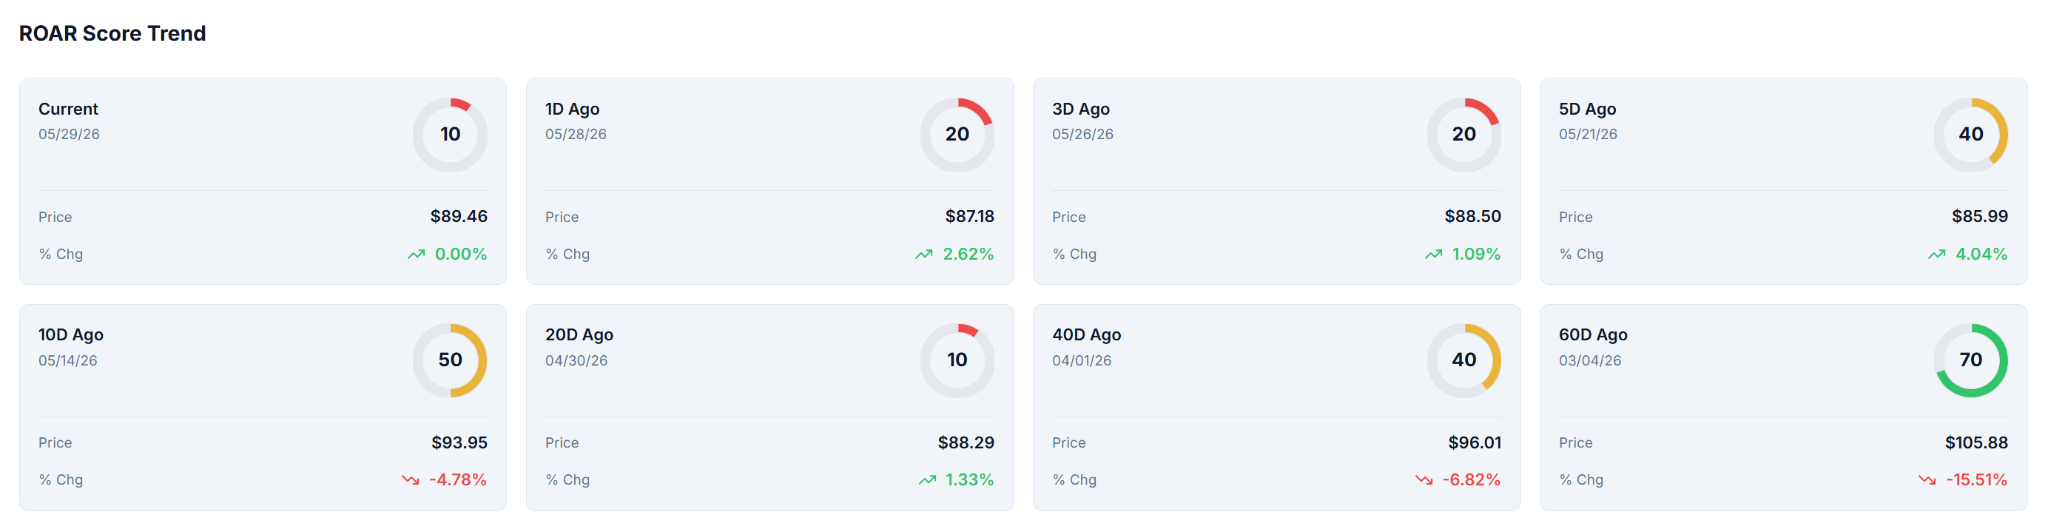 Chart courtesy of Rob Isbitts via PiTrade.com
 The fundamental justification for gold miners was built on the back of soaring spot gold (GCM26) prices. It always is. However, the behavior of the precious metals market has undergone a dramatic shift.
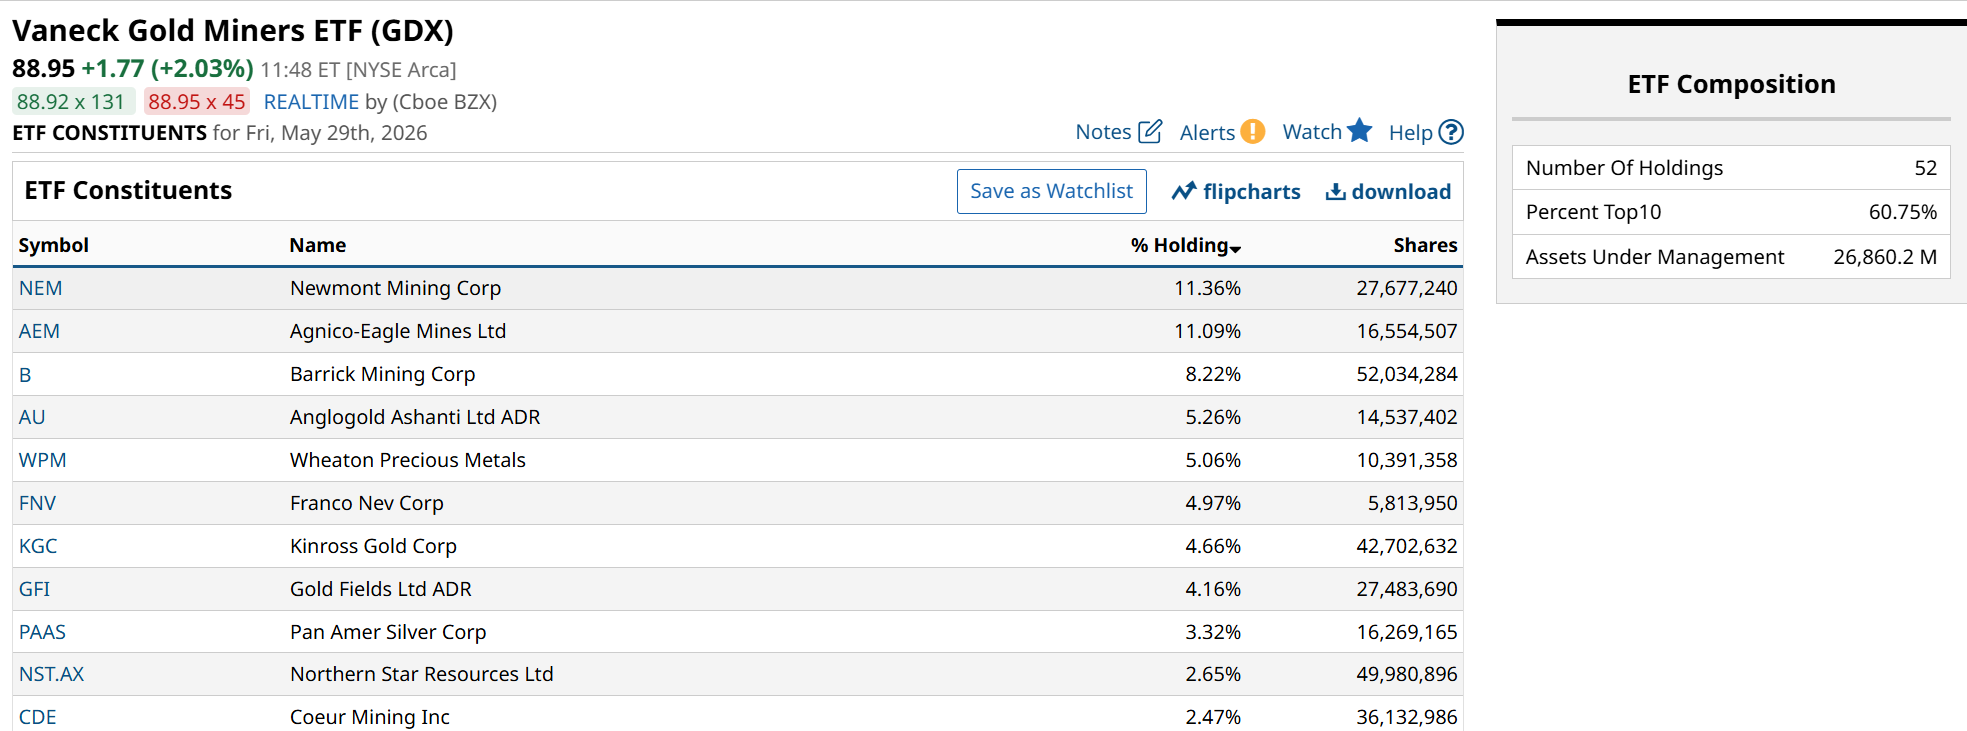
The massive, institutional tailwinds that pushed the sector to its highs — aggressive central bank allocations and high-leverage retail speculation — have aggressively cooled. Global gold ETFs have faced severe, multibillion-dollar capital outflows. When a sector’s narrative shifts from aggressive accumulation (especially due to simply riding the coattails of the underlying commodity’s price) to widespread deleveraging, the underlying equities are treated as high-beta sources of cash.
 www.barchart.com
 Because mining operations carry heavy fixed-input costs and capital-expenditure obligations, even a mild stabilization or retreat in the spot commodity wreaks havoc on forward corporate earnings estimates. The highly touted “operational leverage” that supercharged the miners on the way up operates as a double-edged sword on the way down. It now amplifies the speed of profit margin compression.
As I like to say, sometimes the market treats gold stocks as gold. And sometimes, it treats them like stocks.
In this case, with every equity outside of the AI trade seemingly languishing, it appears to me that GDX and its component stocks are bound to be part of the sell side for a while.
Rob Isbitts created the ROAR Score, based on his 40+ years of technical analysis experience. ROAR helps DIY investors manage risk and create their own portfolios. For Rob’s written research, check out ETFYourself.com.
On the date of publication, Rob Isbitts did not have (either directly or indirectly) positions in any of the securities mentioned in this article. All information and data in this article is solely for informational purposes. For more information please view the Barchart Disclosure Policy here.
More news from Barchart
A ‘Golden Dome’ Has Formed on the Chart of This Gold Mining ETF. The Bull Rally in Precious Metals Has Run Out of Steam. 2 Weeks in May Rekindled My Love for Stock Picking. Here’s My Daily Trading Routine. The S&P 500’s Price Is Getting Better Every Week, But This Indicator Keeps Getting Worse. Why 52% Could Be The Market’s Tragic Number. Unusual Options Activity in Key ETFs Unveils 3 Trade Ideas Here