
Related tickers
| # | Ad | Fiyat | 24s % | 7g % | 1A % | 1Y % | Son 7 Gün | |
|---|---|---|---|---|---|---|---|---|
| 1 | LTCUSD Litecoin vs US Dollar | 59.25 USD | -2.57% | -9.22% | +10.56% | -38.36% | ||
| 2 | ETHUSD Ethereum vs US Dollar | 2419.46 USD | -3.10% | -5.72% | -5.85% | -41.12% | ||
| 3 | MBTUSD milliBitcoin vs US Dollar | 81.645 USD | -1.67% | -1.65% | +3.63% | -27.65% | ||
| 4 | ETCUSD Ethereum Classic vs US Dollar | 7.964 USD | -1.35% | -4.54% | +3.83% | -52.79% |
Haberler
XRP Kore’den Uzaklaşıyor mu: Chainalysis ve Upbit Verileriyle Son Durum
Kripto para borsası Coinbase’den kuantum uyarısı: “Büyük hata olur”
Bitcoin ve Kuantum Bilgisayarlar: Coinbase’in Planı Ne Anlatıyor?
Bitcoin ABD enflasyon verisi öncesi 83 bin dolarda sabit
Ledger’da yeni detay ve korku: “Avrupa-Asya” ibaresi çıktı
Wall Street’dan 110 milyar Dolar’lık Tahvil Uyarısı: Hisse ve Bitcoin’e Etkisi
Ethereum’da FOMO Yeniden: ETF yatırımcıları 10 gündür satışta
Kongre’yi Demokratlar kazanırsa kriptoda soruşturmalar başlayabilir: Reuters haberi
Binance en büyük faaliyetlerinden birini kapatıyor: 4 ana hizmet artık olmayacak
Açıklanmayan transferlerdeki Bitcoin’ler satılmamış olabilir: K33 analizi
Bitcoin’lerini çaldırmaktan son anda karısı kurtardı: Dolandırıcılar seviyeyi iyice yükseltti
Grafikler ve Fikirler
BTCUSD H4 ANALYSIS
BTCUSD H4 Analysis
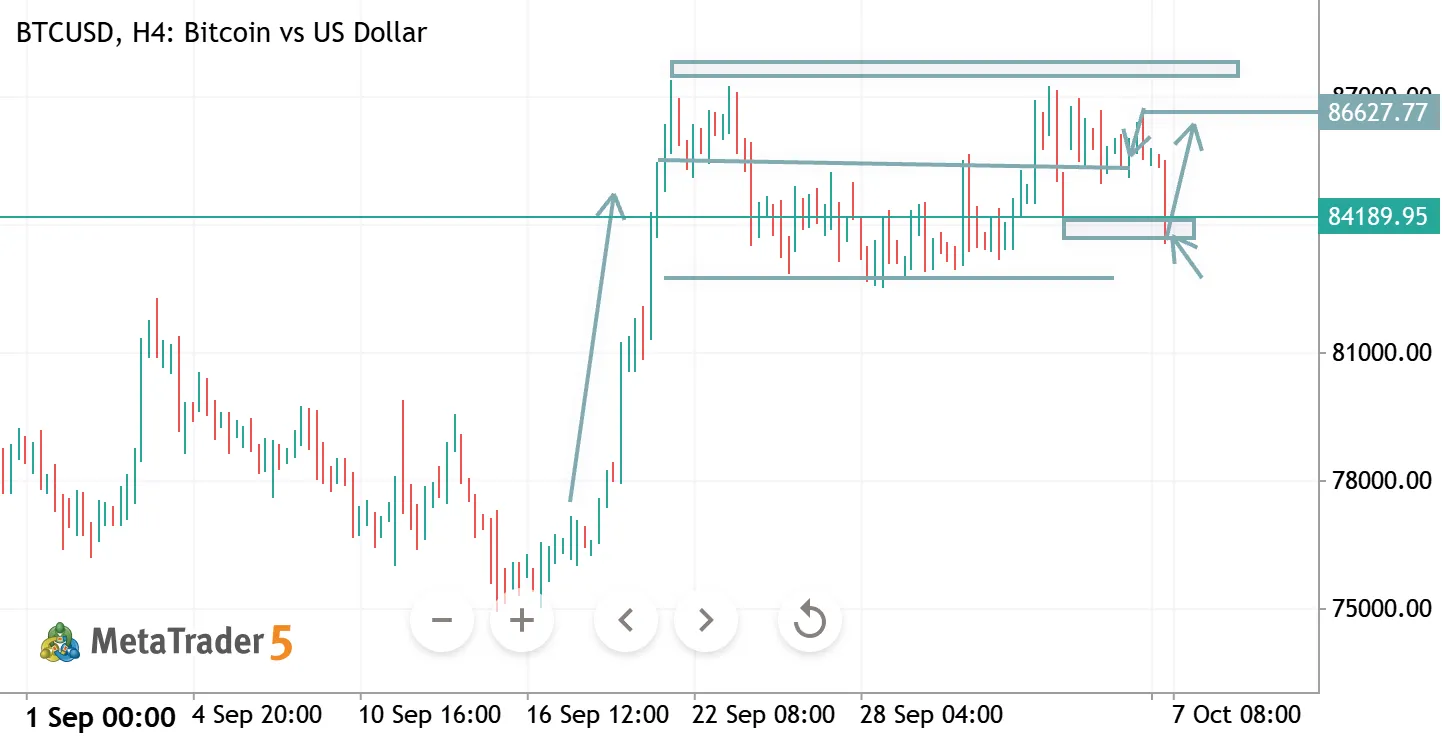
BTC is consolidating near 84,100 after a strong recovery. The 84,000–84,500 zone is key support; holding above it could push price back toward 86,700–88,000.
🔹 Support: 84,000–84,500 🔹 Resistance: 86,700–88,000 🔹 Bias: Bullish above 84,000 🔹 Key Trigger: Break above 86,700 → upside continuation.

BTCUSD H4 ANALYSIS
BTCUSD H4 Analysis
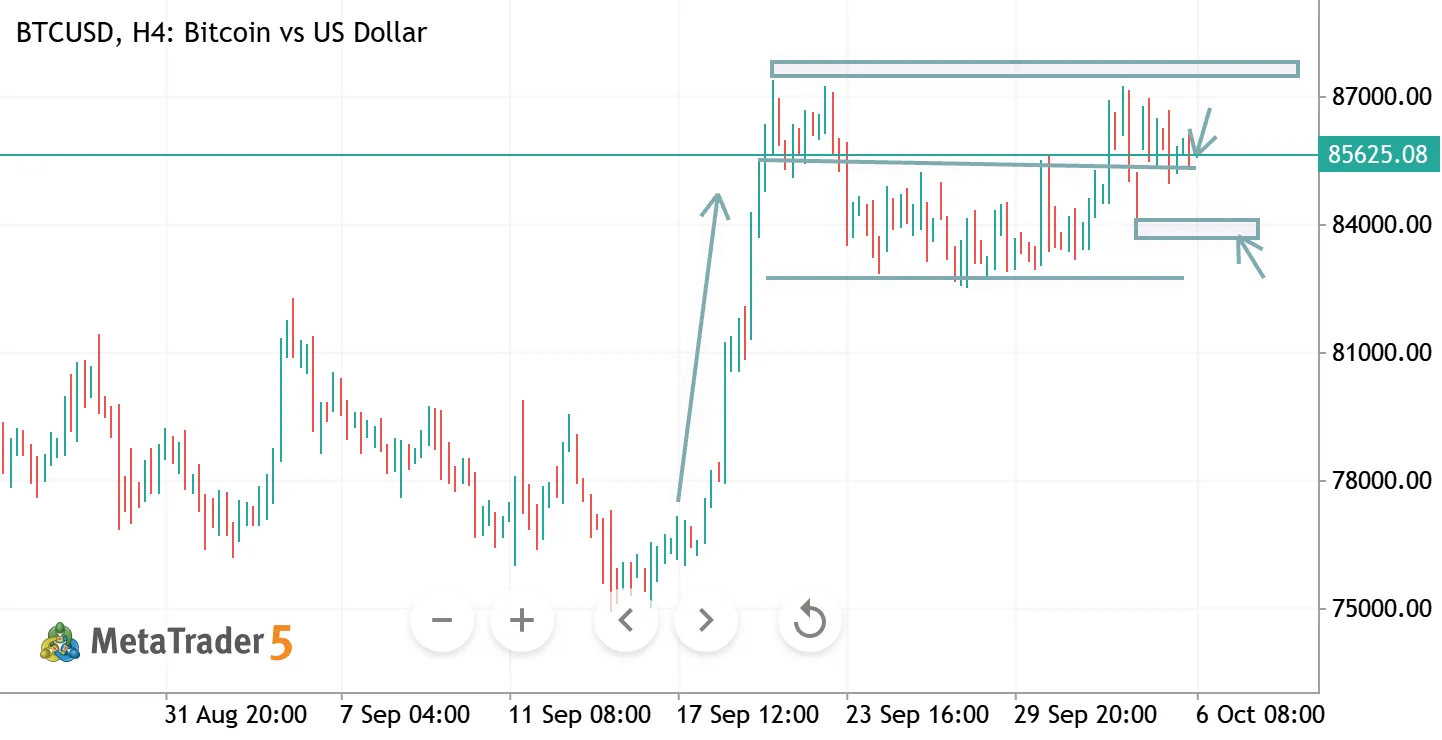
BTC is consolidating below the 86,000–87,000 resistance zone after a strong recovery. A breakout above this area could resume the bullish move toward 88,000, while rejection may pull price back toward 84,000–82,500.
🔹 Resistance: 86,000–87,000 🔹 Support: 84,000–82,500 🔹 Bias: Bullish above 84,000 🔹 Key Trigger: H4 close above 87,000 → upside continuation.
BTCUSD H4 ANALYSIS
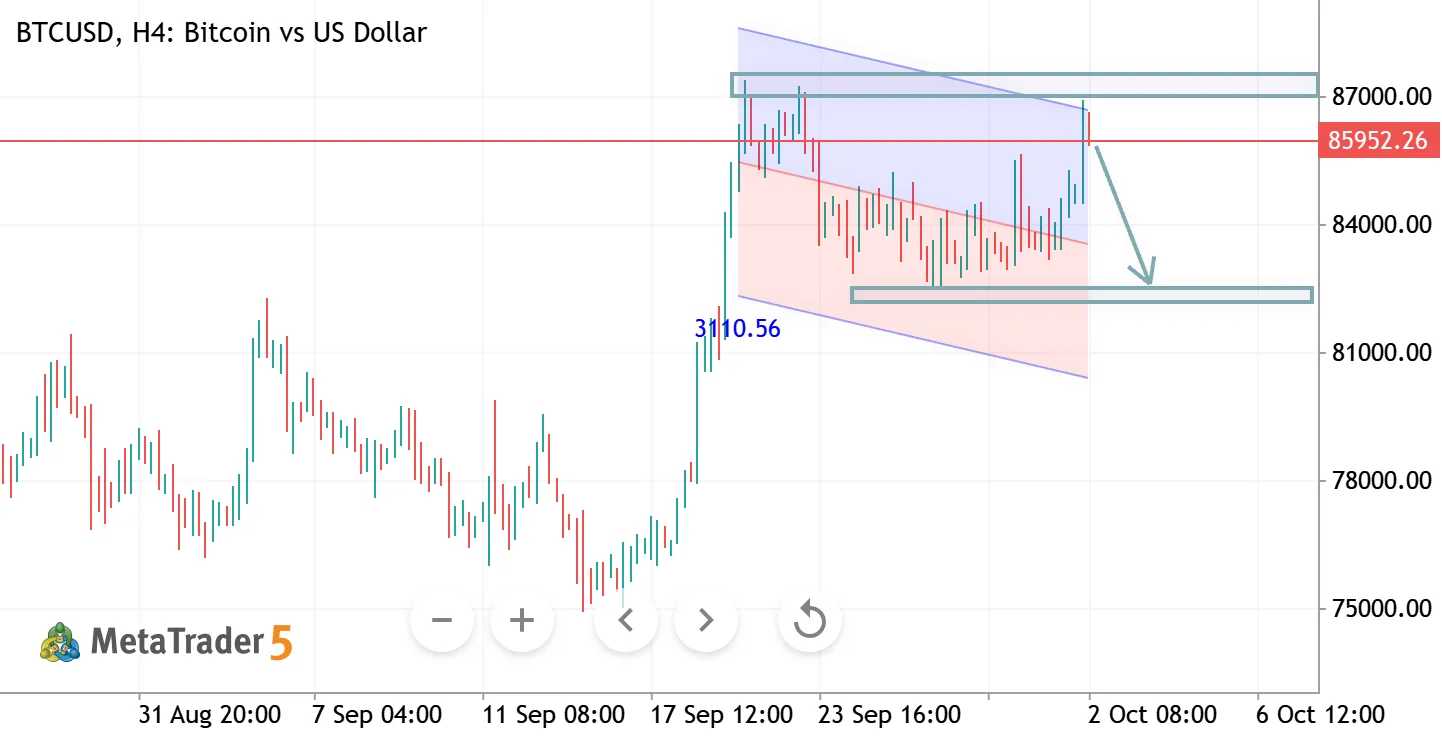
BTCUSD H4 Analysis Bitcoin is testing a major resistance zone around 85,800–86,500 after a strong recovery. Rejection here could trigger a pullback toward the 82,000 support zone. 🔹 Resistance: 85,800–86,500 🔹 Support: 82,000–82,500 🔹 Bias: Bearish below 86,500 🔹 Key Trigger: Break above 86,500 → bullish continuation; rejection → downside toward 82,000.
BTCUSD H4 ANALYSIS
GBPUSD – Technical Analysis 📊
GBPUSD is showing signs of a potential bullish reversal after moving within a descending channel. Price is holding around 1.3230, with the chart indicating a possible move toward the 1.3380–1.3400 resistance zone.
🔹 Support: 1.3200–1.3230 🔹 Target Zone: 1.3380–1.3400 🔹 Key Level: Sustained strength above 1.3260 would support the bullish setup.
Disclaimer: Technical analysis is based on chart structure and is not financial advice.
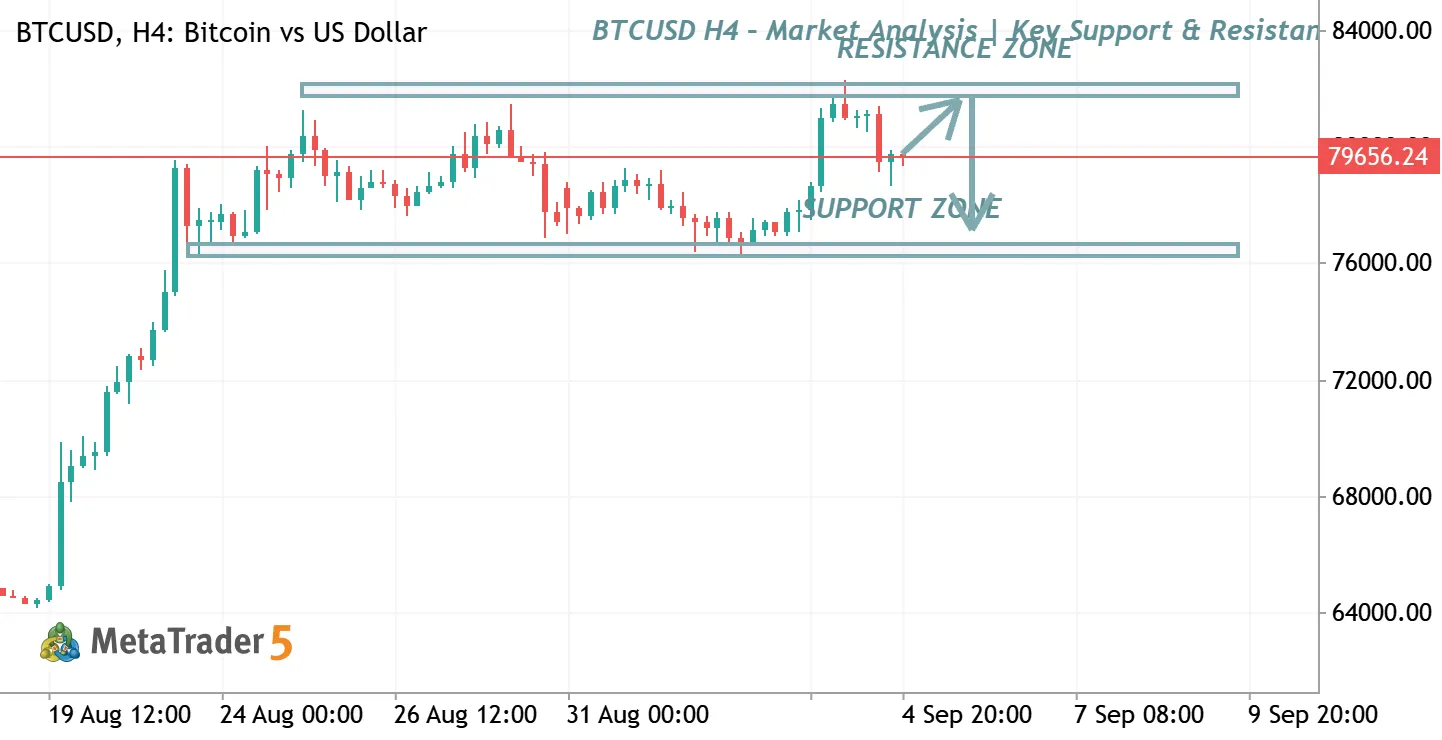
BTCUSD H4 – Market Analysis | Key Support & Resistance
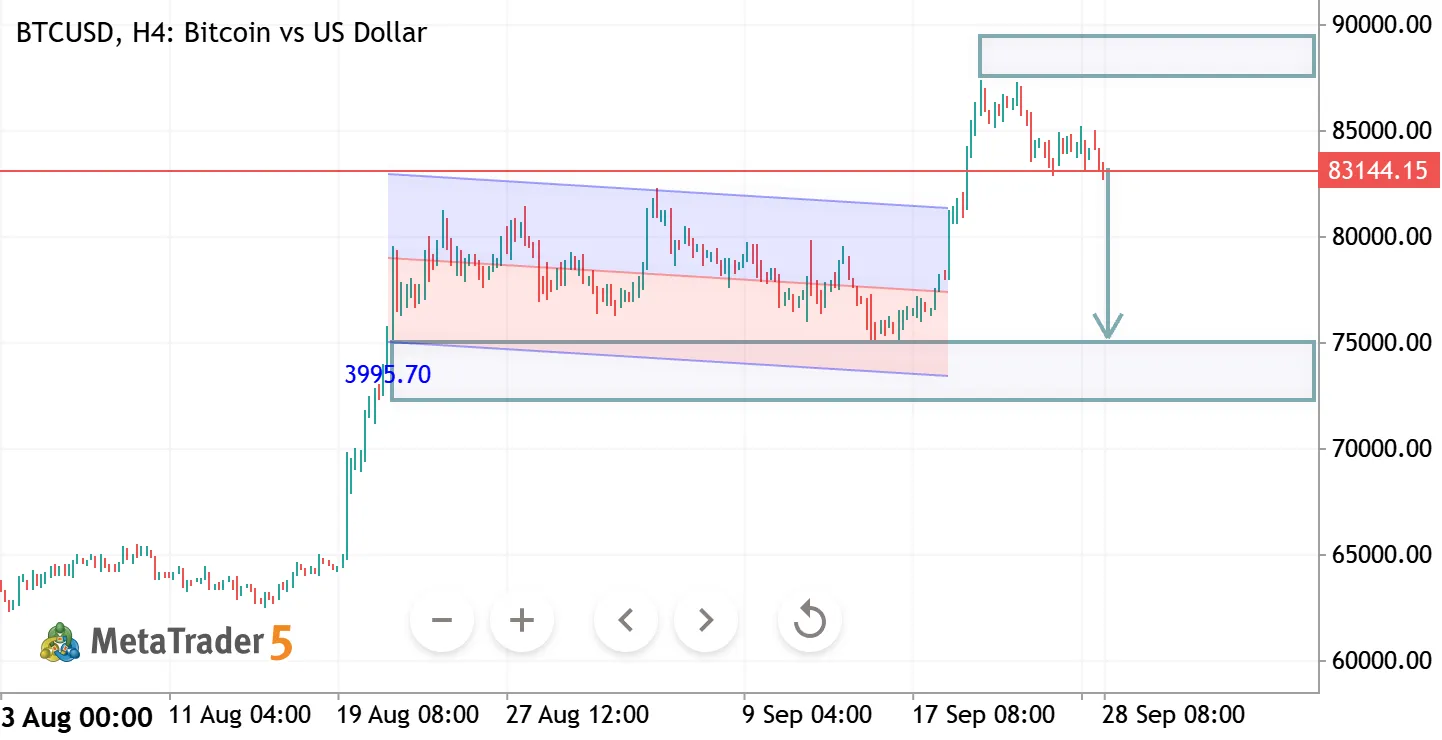
BTCUSD is currently trading between important support and resistance zones on the H4 timeframe. Price is approaching a critical area where traders should watch for confirmation of either a bullish breakout toward the resistance zone or a bearish rejection toward support . 📈 Bullish Scenario: Break and hold above resistance may open the way for further upside.
📉 Bearish Scenario: Rejection from resistance could lead price back toward the major support zone. ⚠️ Trade with proper risk management and wait for confirmation before entering

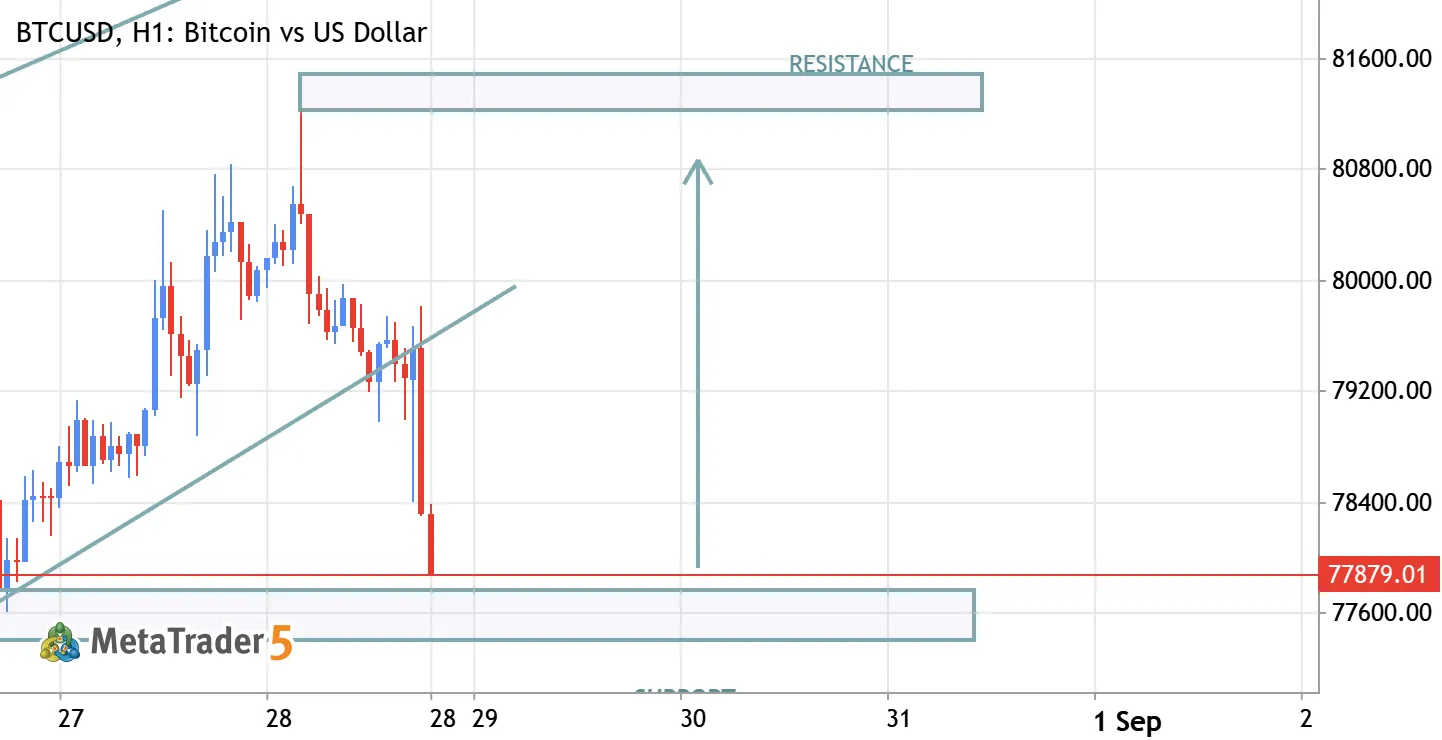
BTCUSD BULLISH TREND AFTER SUPPORT
BTCUSD BULLISH FROM SUPPORT TARGETS 81600


The BTCUSD doesn’t have other trading ideas at this time
Browse ready-made trading ideas or select a symbol and create your own
Go to Charts and Trading Ideas