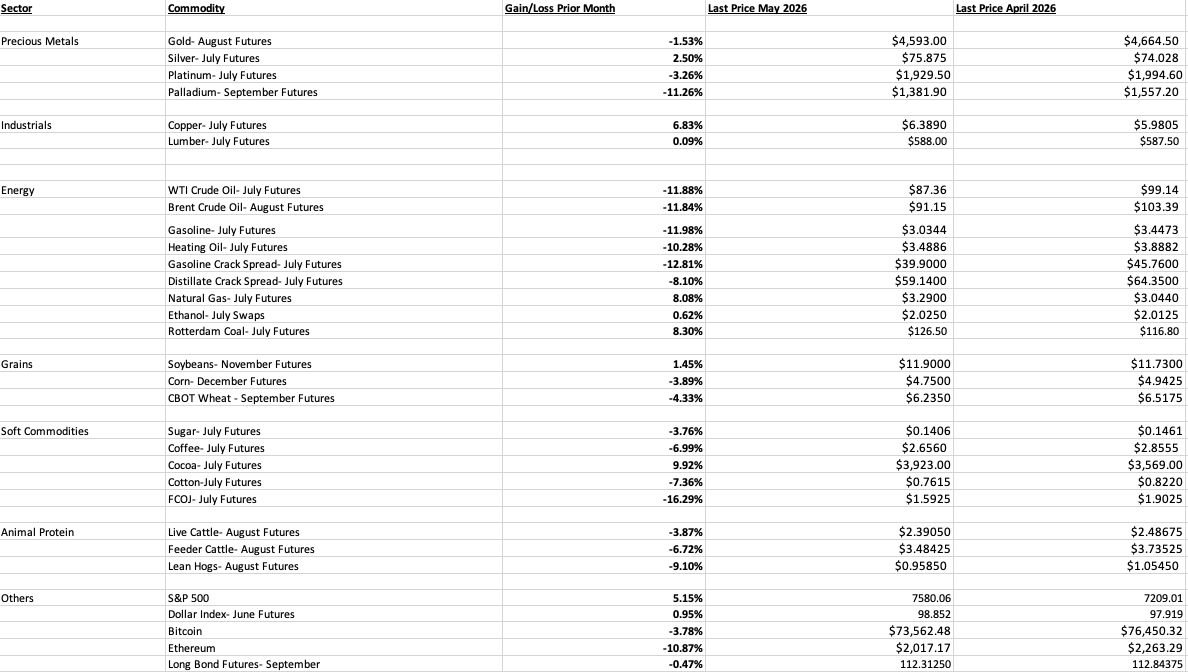
In the commodities asset class in May 2026, ICE cocoa futures were the only commodity to post just below a double-digit percentage gain. Palladium, WTI, Brent crude oil, gasoline, heating oil, gasoline crack spreads, frozen concentrated orange juice, and Ethereum declined by over 10%. The leading stock market indices moved higher, while the long bond futures were steady. The dollar index rose by 0.95%. The long bond futures fell by 0.47%. A higher dollar and elevated interest rates weighed on many commodity prices.
Oil remains in focus
A continued ceasefire and hopes of a settlement between Iran and the United States that opens the Strait of Hormuz, a critical logistical chokepoint for crude oil, sent crude oil, oil products, crack spreads, and fertilizer prices lower in May.
Don’t Miss a Day: From crude oil to coffee, sign up free for Barchart’s best-in-class commodity analysis.
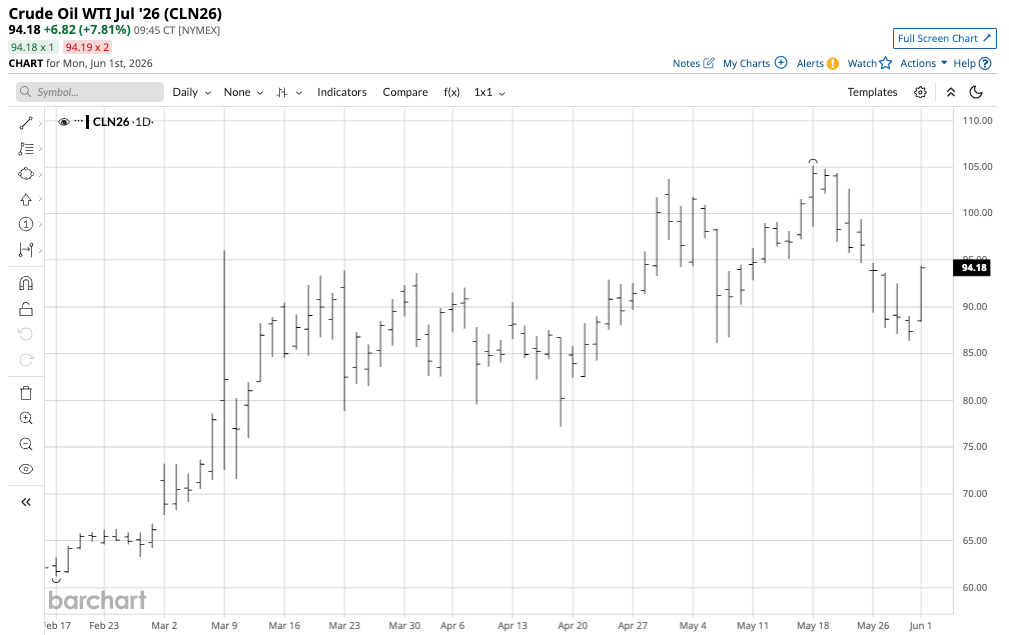
The monthly July NYMEX WTI crude oil futures chart shows that the price fell 11.88% in May. Brent crude oil, the benchmark for Middle Eastern petroleum, kept pace with the WTI, posting an 11.84% monthly decline on the ICE August contract.
Gasoline futures moved 11.98% lower, while heating oil futures, which are a proxy for other distillate fuels, fell 10.28%. The heating oil futures slightly outperformed the gasoline futures, even though the energy market moved into the 2026 driving season, the peak season for gasoline demand.
Crack spreads reflect the refining margins for processing crude oil into gasoline and distillate products. The gasoline crack spread moved 12.81% lower in May, while the distillate crack spread posted an 8.10% decline.
July Chicago ethanol swaps, the biofuel additive to U.S. gasoline, rose 0.61% for the month, while coal for delivery in Rotterdam, the Netherlands, rose 8.30% in May, even though heating demand declines during spring. Meanwhile, July U.S. natural gas futures prices rose 8.08% as natural gas is entering the cooling season. European natural gas prices were steady due to the upcoming cooling season and Middle Eastern supply concerns. U.K. natural gas futures prices for July delivery edged 0.15% higher in May, while natural gas futures prices in the Netherlands for July delivery increased by 0.40% for the month ending on May 29. The Middle East continued to cause supply concerns.
Precious metals were mostly lower, while copper reached a new record high in May
Precious metal prices soared in 2025 and early 2026, but they ran out of upside steam in late January.
Gold, the leading precious metal, moved 1.53% lower in May. The volatile silver futures market moved 2.50% higher. NYMEX palladium futures fell 11.26%, leading on the downside, while NYMEX platinum futures moved 3.26% lower.
Copper, the leading nonferrous metal, experienced a 6.83% gain in the nearby futures contract. July COMEX copper rose to a new record high of $6.7160 in mid-May, while base metals were mostly higher in May.
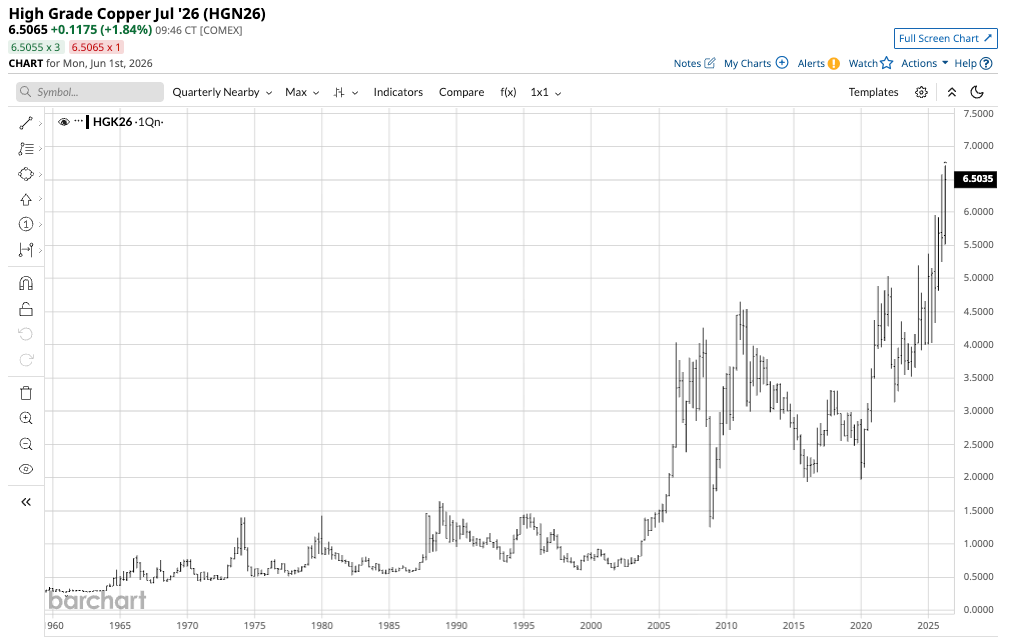
The quarterly chart highlights the bullish trend in copper that took the red metal to a new record high in May 2026.
LME three-month copper forwards moved higher, but remained below its January 2026 record high. LME aluminum three-month forwards rallied, LME nickel forwards were lower, LME lead forwards moved to the upside, LME zinc prices rallied, and LME tin forwards also posted an impressive gain.
Grains and softs were mostly lower, and lumber edged higher
As the growing season in the Northern Hemisphere is well underway. However, the grain and oilseed markets have faced fertilizer shortages, as the Strait of Hormuz is a logistical chokepoint for this critical agricultural input. New crop November Soybean futures prices moved 1.45% higher, while new crop December corn futures fell 3.89%, and September CBOT soft red winter wheat futures moved 4.33% lower. Since Russia and Ukraine are major wheat producers, the ongoing war had driven up wheat prices, but fertilizer prices and supplies likely provided the most support for grain and oilseed prices over the past two months. However, the prospects for an end to the conflict caused corn and wheat prices to decline in May.
There was little change in physical lumber futures in May, pushing the July futures contract only 0.09% higher.
The 2026 peak grilling season arrived in late May. Cattle prices have been at record highs, but declined in May. The live and feeder cattle futures for August delivery fell 3.87% and 6.72%, respectively, in May. Meanwhile, the lean hog futures for August delivery declined 9.10% for the month.
Soft commodities posted were mostly lower in May, with cocoa and world sugar futures moving 9.92% higher and 3.76% lower, respectively. Cotton, which had posted a nearly 14% gain in April, fell 7.36% in May. Arabica coffee futures fell 6.99%. The volatile FCOJ futures led on the downside with a 16.29% decline in May.
Spotlight on gold and silver- A buying opportunity?
Since reaching record highs in late January, COMEX gold and silver futures have corrected, and have made lower highs.
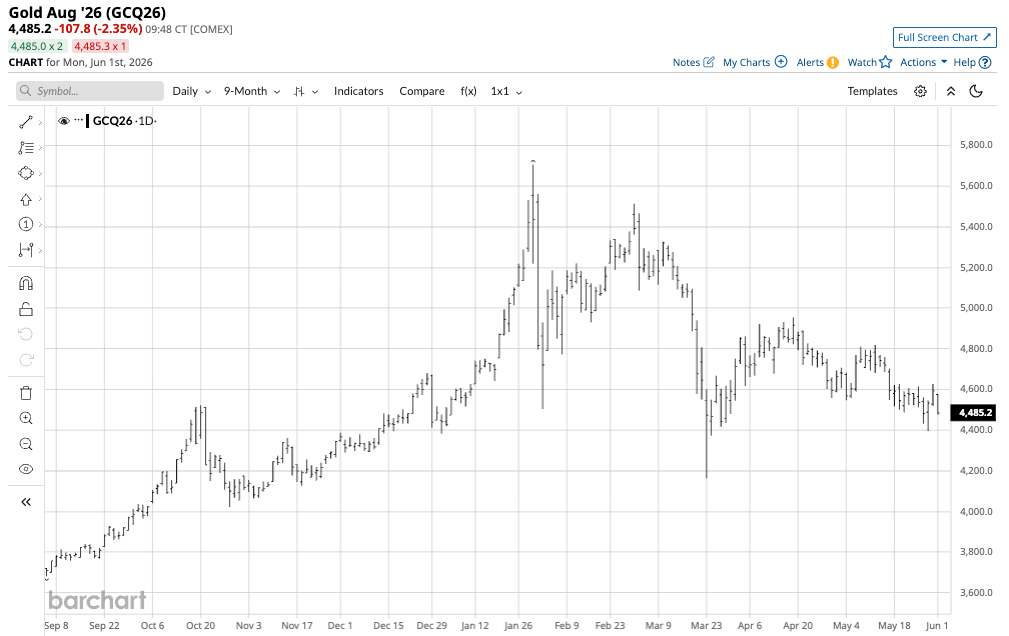
The chart shows that after reaching a record high of $5,706 on January 29, 2026, gold corrected 27.1% to a $4,162 low per ounce on March 23. While August COMEX gold futures settled near $4,595 per ounce on Friday, May 29, it remains in a bearish trend, making lower highs and lower lows since late January.
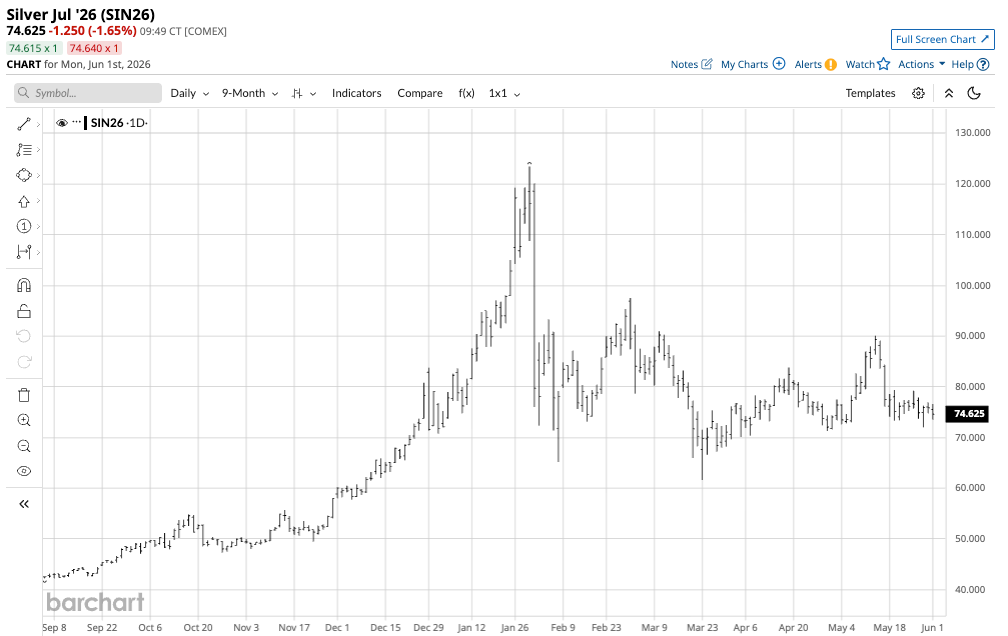
The chart highlights that after reaching a record high of $123.45 on January 29, 2026, July COMEX silver futures corrected 50% to a $61.66 low on March 23. While silver was trading near $76 per ounce on Friday, May 29, it remains in a bearish trend, making lower highs and lower lows since late January.
Meanwhile, the long-term charts remain in bullish trends, despite the corrections.
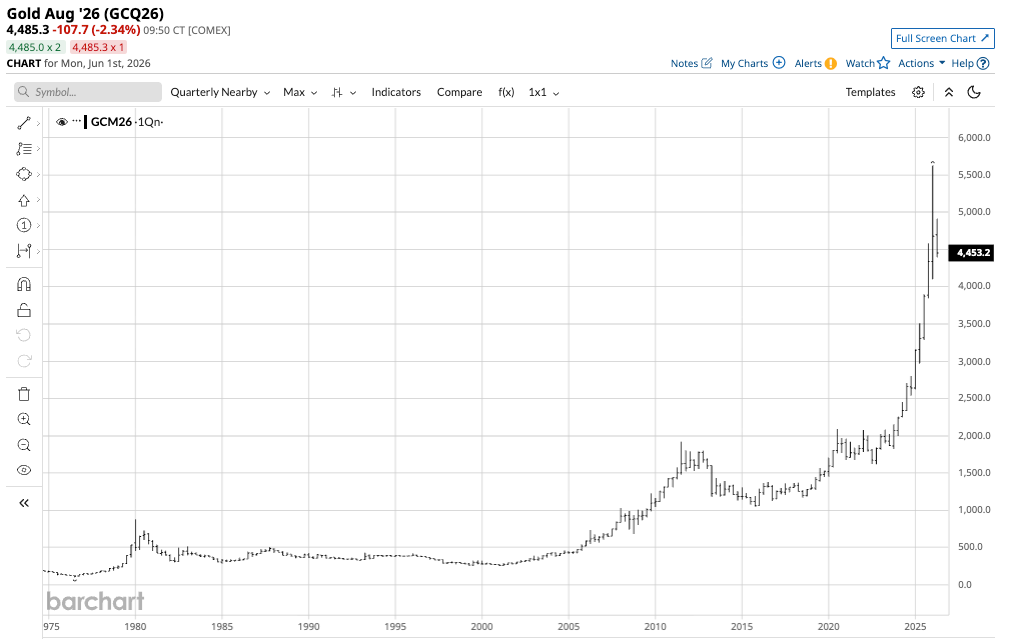
Gold’s bullish trend since 1999 remains firmly intact, with the first technical support at the Q3 2020 high of $2,089.20 per ounce.
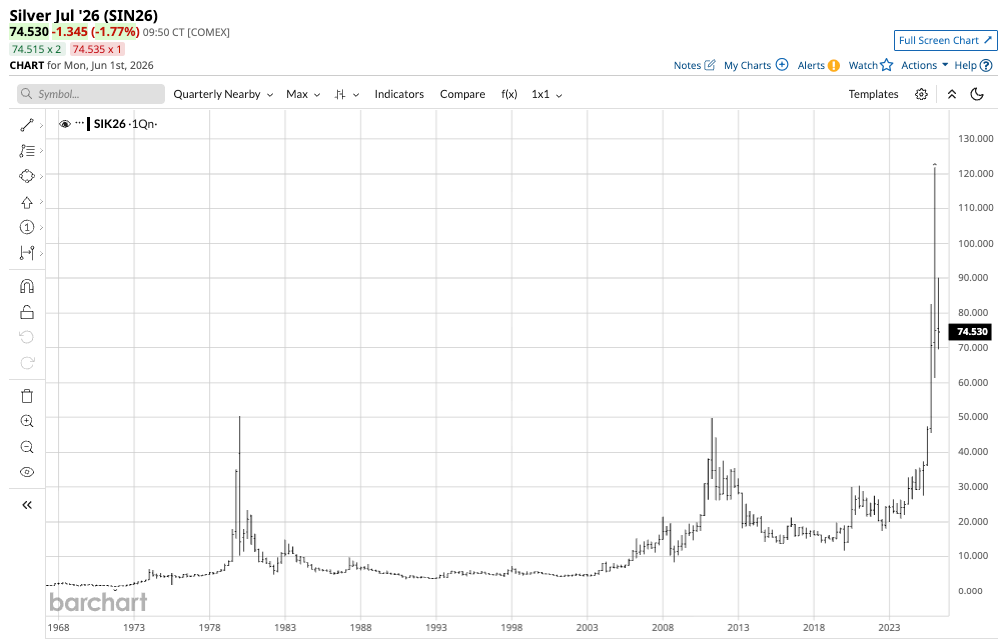
Silver’s bullish trend since Q1 2020 remains firmly intact, with the first technical support at the 1980 high of $50.36 per ounce.
JPMorgan analysts forecast that gold will reach $6,000 per ounce in the second half of 2026. UBS expects gold to reach $5,500 this year, while Bank of America is forecasting a $6,000 target. Goldman Sachs is slightly more conservative, with a $5,400 per ounce target.
The bottom line is that the leading financial institutions believe gold will move substantially higher from its current $4,593 per ounce level on the August futures contract. If gold is going to take off on the upside and challenge its late January 2026 high, silver is likely to follow. Therefore, buying gold and silver at the current prices could be a golden opportunity for later this year.
Factors to watch in June 2026
As commodities move into June, they face significant events in the economic and geopolitical landscapes. Seasonality favors some strength in grains, meats, and gasoline. The situation in the Middle East will continue to dictate the path of least resistance for energy and other commodity prices. The 2026 grilling season is underway, which could support beef and pork prices after the May declines. Cryptocurrencies have been consolidating and could either break higher or lower over the coming weeks. The upcoming U.S. midterm elections could begin to impact markets over the coming weeks and months.
Keep a close eye on those metals, as gold and silver remain in long-term bullish trends. The continued decline in fiat currencies’ purchasing power remains a factor supporting metals and all commodities.
The bull market in stocks continues, but the economic and geopolitical landscapes will determine the path of least resistance for U.S. stocks. Bonds have not broken out of their long-term consolidation pattern, but interest rates remain elevated. Interest rates could decline if oil prices continue to decline. Lower oil prices should decrease inflationary pressures, setting the stage for another Fed rate cut under the new Chairman, Kevin Warsh.
Expect continued volatility in the commodities asset class in June 2026 and beyond, and you will not be surprised or disappointed.
On the date of publication, Andrew Hecht did not have (either directly or indirectly) positions in any of the securities mentioned in this article. All information and data in this article is solely for informational purposes. For more information please view the Barchart Disclosure Policy here.