
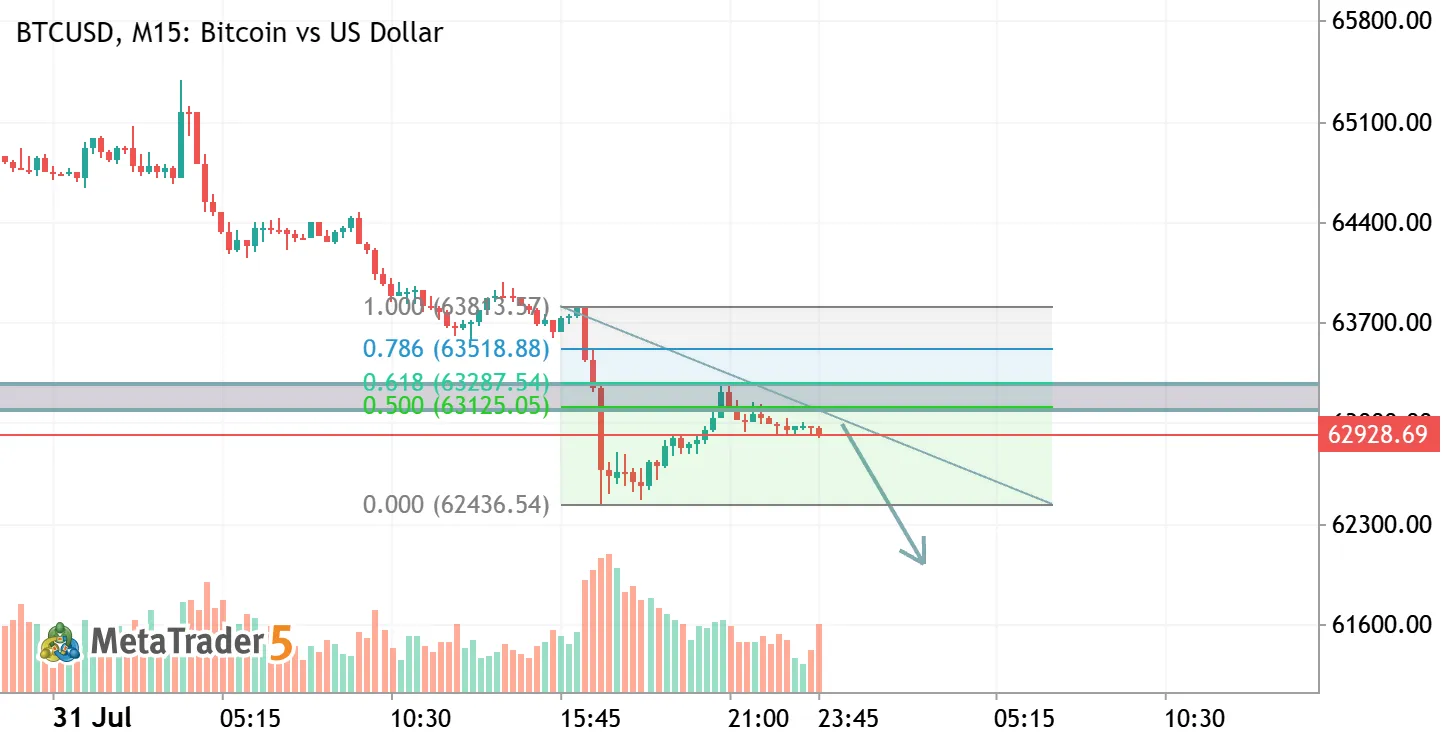
Direction: Short / Sell
Asset: BTCUSD
Timeframe: M15
📍 Key Trade Levels
- Entry Zone: $62,900 – $63,120 (Current market price retesting broken support)
- Stop Loss (SL): $63,550 (Above the 0.786 Fibonacci level / high of the recent pull-back)
- Take Profit 1 (TP1): $62,440 (Recent local swing low)
- Take Profit 2 (TP2): $62,000 (Extended target as projected by the trend arrow)
📊 Setup Rationale
- Support Breakout: Price aggressively broke down below the previous key horizontal support zone ($63,120 – $63,280).
- Fibonacci Golden Zone Confluence: The retracement move tapped directly into the 0.50 ($63,127) and 0.618 ($63,288) Fibonacci retracement level, which now acts as strong resistance.
- Bearish Market Structure: Lower lows and lower highs are clearly established on the short timeframe following the sharp sell-off from the $65,200 region, keeping overall momentum downward.
⚠️ Disclaimer: Not financial advice. Trading cryptocurrencies carries a high level of risk. Always perform your own research and strictly manage your risk.
#BTC #Bitcoin #CryptoTrading #PriceAction #TechnicalAnalysis #ShortSignal #SmartMoneyConcepts #TradingSignal

 MQL5 个人资料
新评论