
相关股票代码
| # | 姓名 | 价格 | 24小时 % | 7天 % | 一个月 % | 一年 % | 最近7天 | |
|---|---|---|---|---|---|---|---|---|
| 1 | LTCUSD Litecoin vs US Dollar | 57.79 USD | -0.87% | +1.40% | -18.43% | -41.58% | ||
| 2 | ETHUSD Ethereum vs US Dollar | 2400.18 USD | +0.66% | +2.13% | -10.60% | -41.16% | ||
| 3 | MBTUSD milliBitcoin vs US Dollar | 81.279 USD | +0.07% | +0.54% | -3.73% | -28.44% | ||
| 4 | ETCUSD Ethereum Classic vs US Dollar | 7.785 USD | +1.86% | +4.34% | -17.92% | -52.77% |
新闻
持有3.97亿美元BTC及ETH多单的某巨鲸追加921万美元保证金,ETH清算价降至2181美元
比特币一小时内 2 亿美元杠杆蒸发
Arthur Hayes 抛售 2200 万美元加密货币 警告后市下行
比特币周末面临关键行情风险
分析师:本周比特币现货ETF净流入5183枚,2026年累计转正
Tether支持的Utexo推出Utexo Mint,开放比特币网络上USDT的早期访问权限
比特币 ETF 持有人提前撤出 6.35 亿美元
40个新钱包自10月以来从Wintermute提取9458枚BTC,价值7.715亿美元
比特币面临日本加息及通胀达标风险
比特币 ETF 强势回归,单日吸金 10 亿美元,而以太坊 ETF 仍难翻身:背后的分化原因是什么?
Glassnode:比特币再度测试8.1万美元“ETF成本基准”,若有效跌破或下探7万美元区间
图表与思路
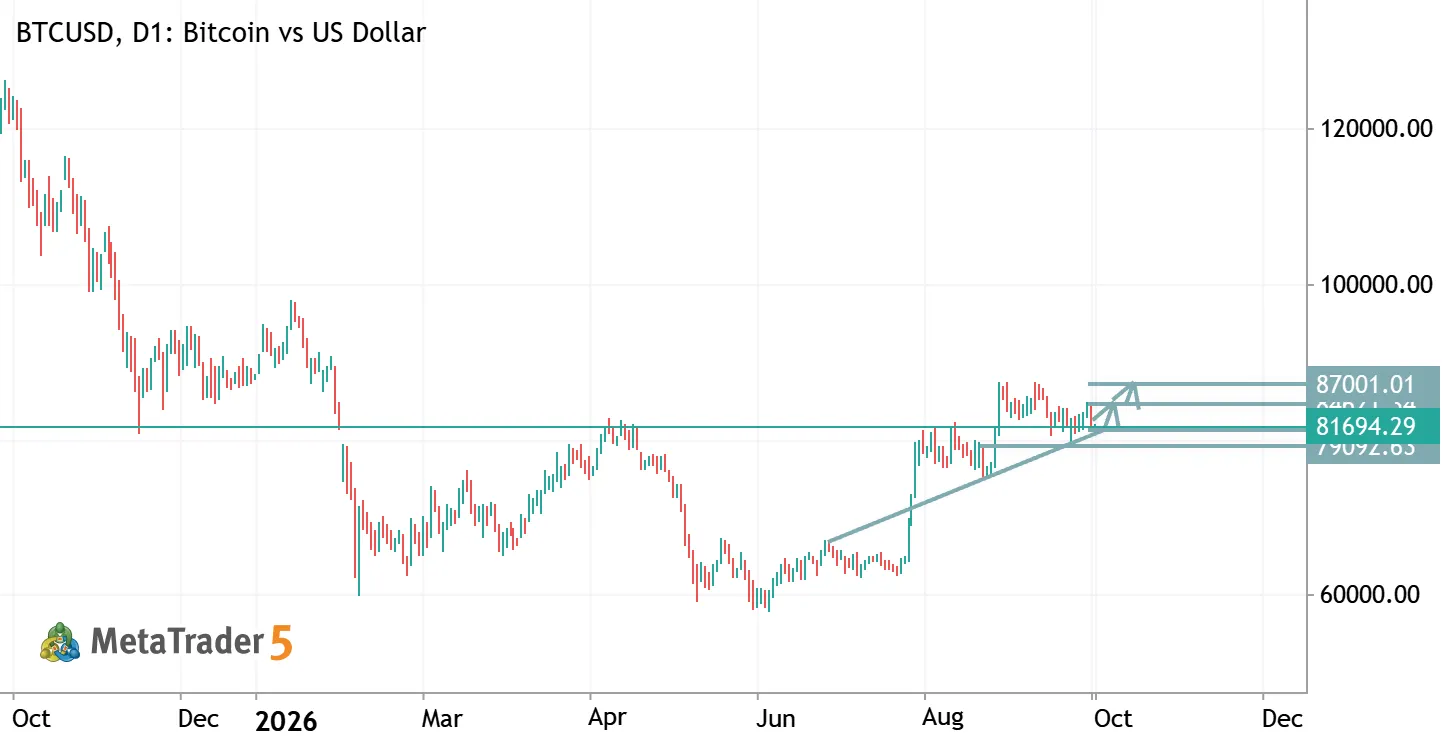
BTCUSD TRADE IDEA
BTCUSD – Trade Analysis (D1) Trend: Bullish recovery; price is consolidating above rising trendline support. Buy Entry: 81,700–82,000 (after bullish confirmation) TP1: 84,621 TP2: 87,001 Support: 79,092 Stop Loss: Below 79,000. Outlook: Bullish above 81,700. A breakout above 84,621 may push BTC toward 87,001. Risk management: Wait for confirmation and risk only a small portion of your capital

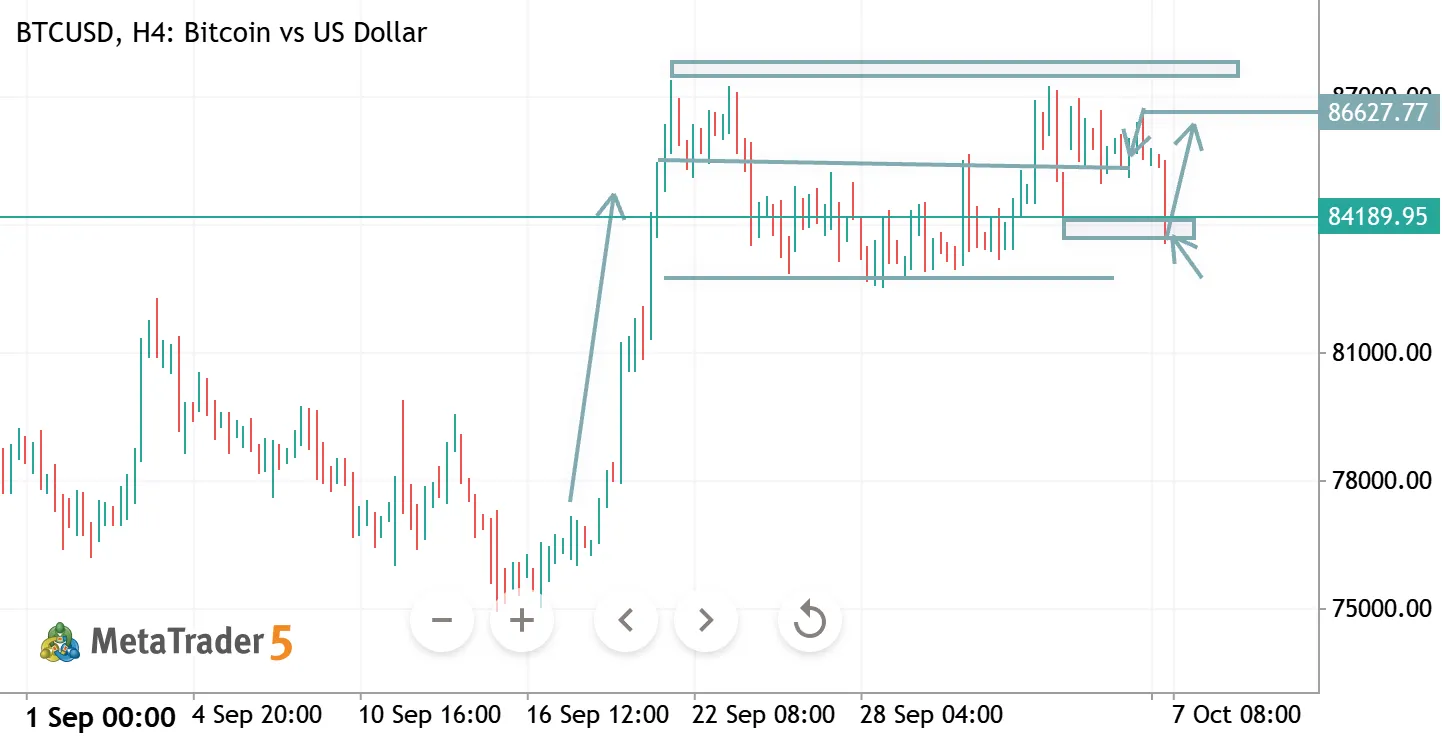
BTCUSD H4 ANALYSIS
BTCUSD H4 Analysis
BTC is consolidating near 84,100 after a strong recovery. The 84,000–84,500 zone is key support; holding above it could push price back toward 86,700–88,000.
🔹 Support: 84,000–84,500 🔹 Resistance: 86,700–88,000 🔹 Bias: Bullish above 84,000 🔹 Key Trigger: Break above 86,700 → upside continuation.

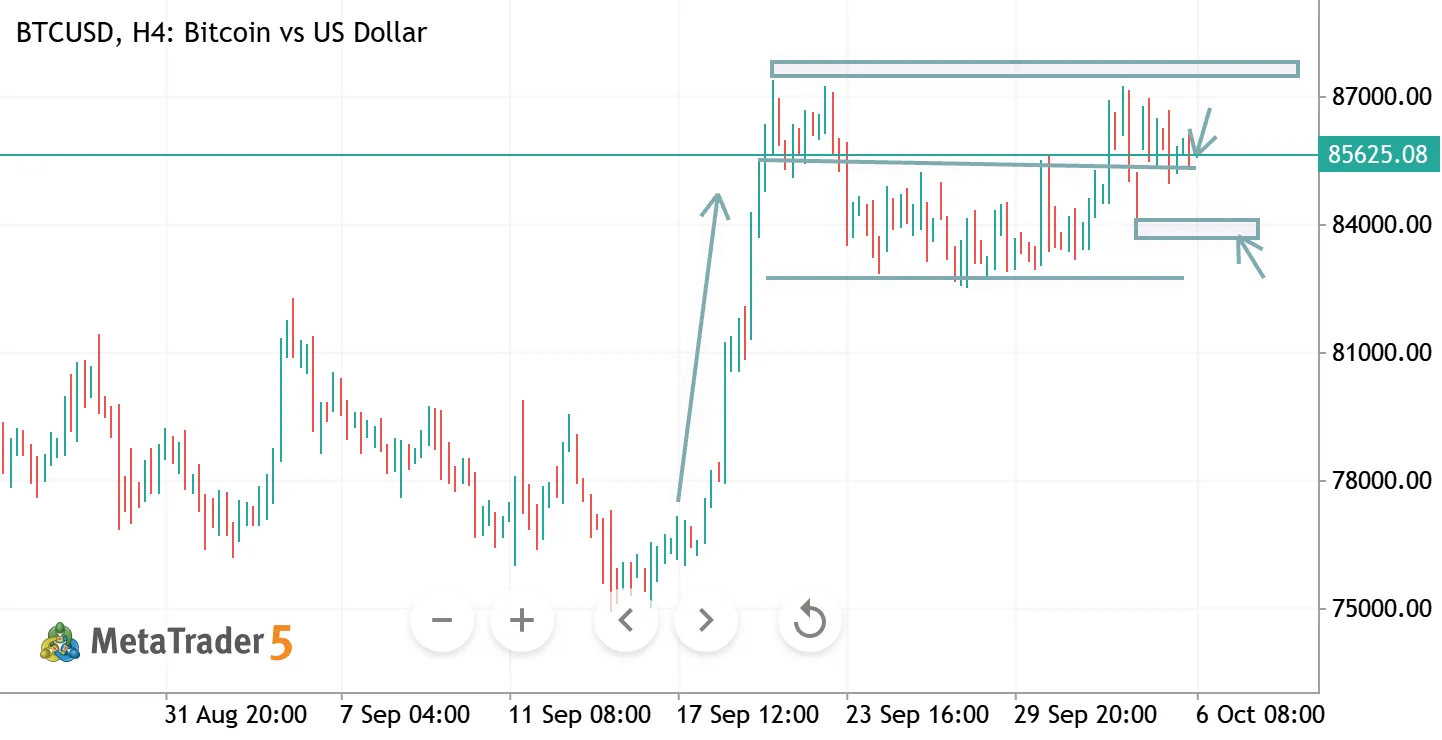
BTCUSD H4 ANALYSIS
BTCUSD H4 Analysis
BTC is consolidating below the 86,000–87,000 resistance zone after a strong recovery. A breakout above this area could resume the bullish move toward 88,000, while rejection may pull price back toward 84,000–82,500.
🔹 Resistance: 86,000–87,000 🔹 Support: 84,000–82,500 🔹 Bias: Bullish above 84,000 🔹 Key Trigger: H4 close above 87,000 → upside continuation.
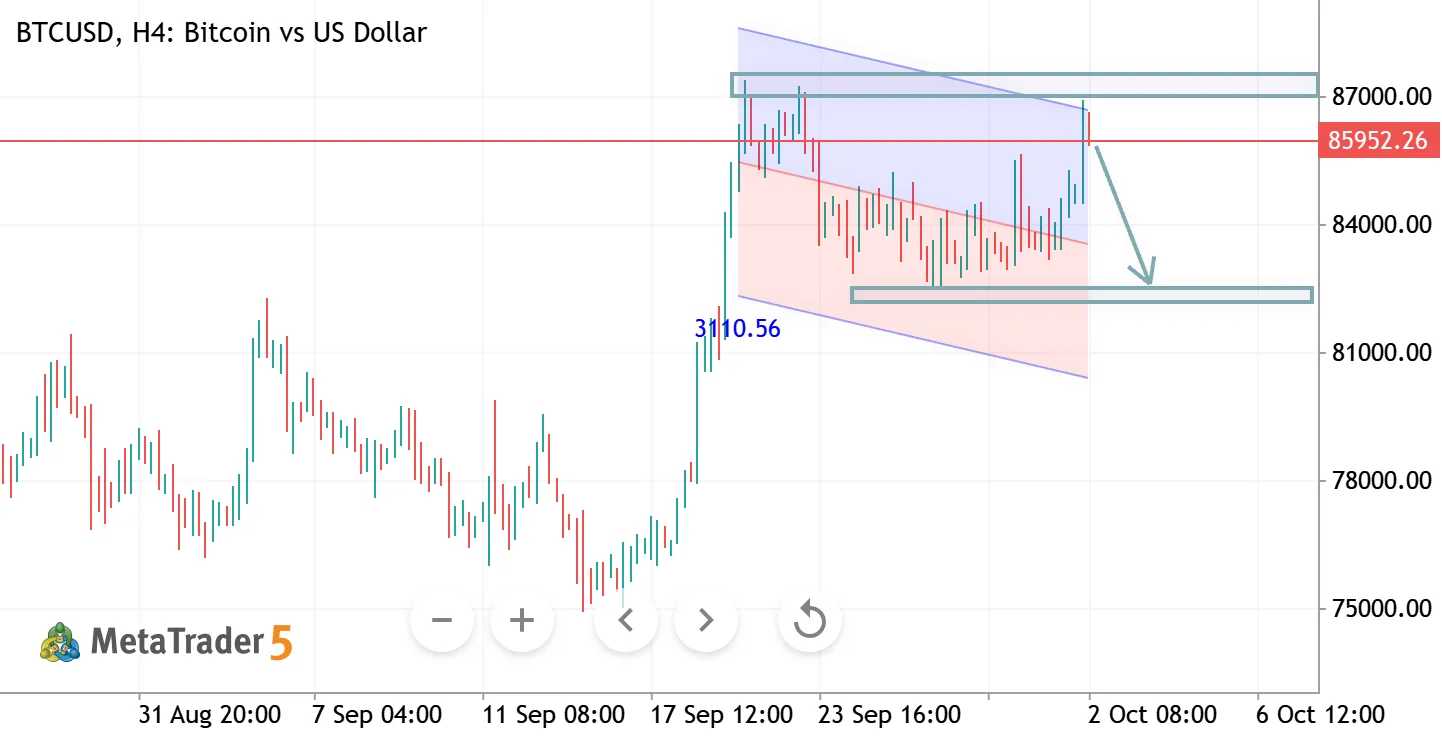
BTCUSD H4 ANALYSIS
BTCUSD H4 Analysis Bitcoin is testing a major resistance zone around 85,800–86,500 after a strong recovery. Rejection here could trigger a pullback toward the 82,000 support zone. 🔹 Resistance: 85,800–86,500 🔹 Support: 82,000–82,500 🔹 Bias: Bearish below 86,500 🔹 Key Trigger: Break above 86,500 → bullish continuation; rejection → downside toward 82,000.
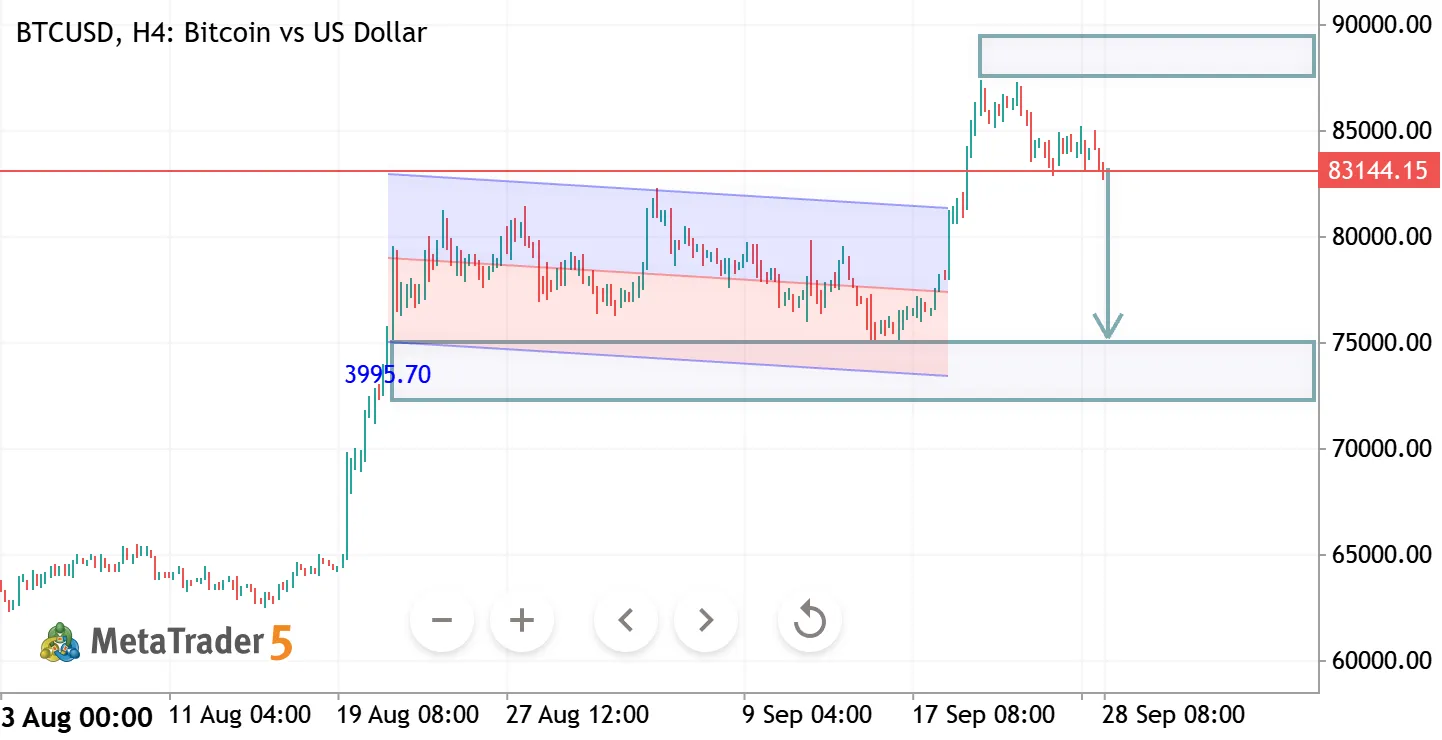
BTCUSD H4 ANALYSIS
GBPUSD – Technical Analysis 📊
GBPUSD is showing signs of a potential bullish reversal after moving within a descending channel. Price is holding around 1.3230, with the chart indicating a possible move toward the 1.3380–1.3400 resistance zone.
🔹 Support: 1.3200–1.3230 🔹 Target Zone: 1.3380–1.3400 🔹 Key Level: Sustained strength above 1.3260 would support the bullish setup.
Disclaimer: Technical analysis is based on chart structure and is not financial advice.
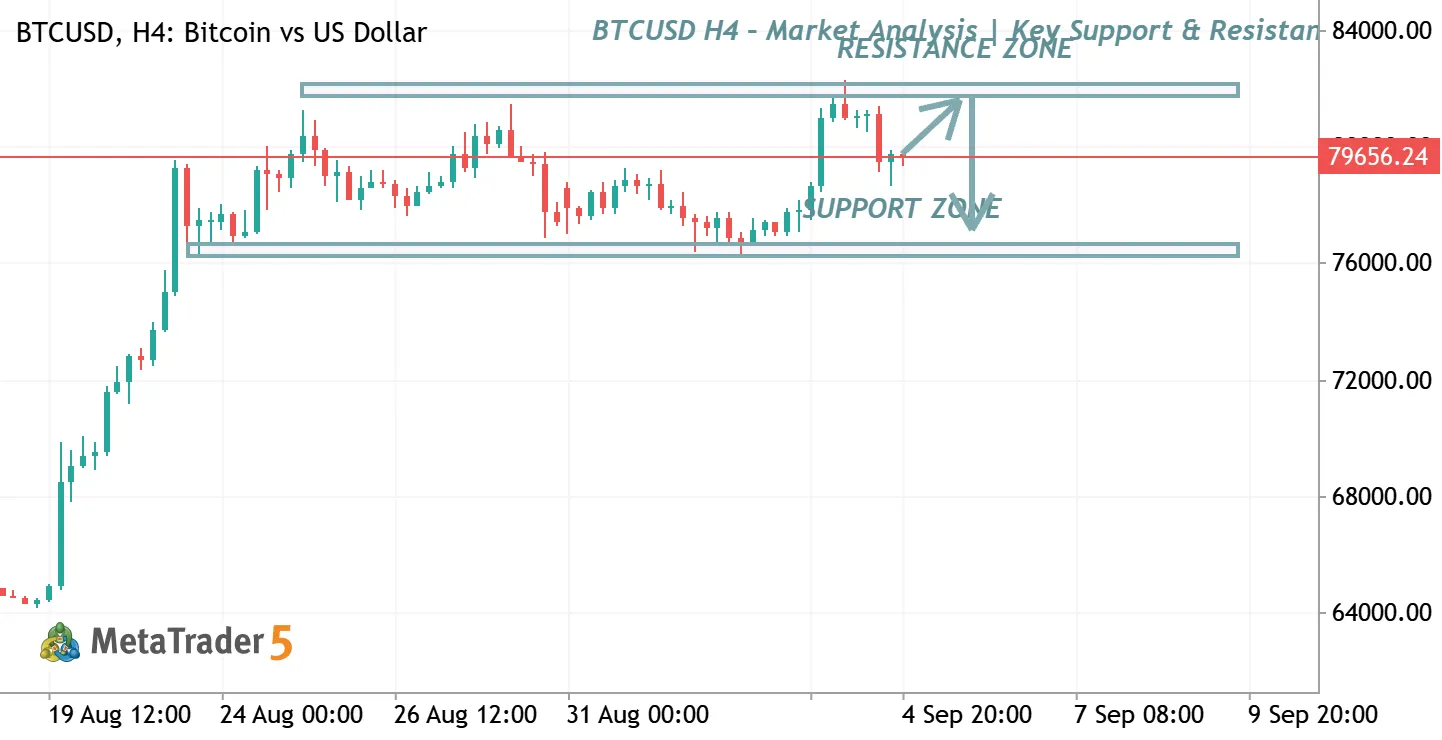
BTCUSD H4 – Market Analysis | Key Support & Resistance
BTCUSD is currently trading between important support and resistance zones on the H4 timeframe. Price is approaching a critical area where traders should watch for confirmation of either a bullish breakout toward the resistance zone or a bearish rejection toward support . 📈 Bullish Scenario: Break and hold above resistance may open the way for further upside.
📉 Bearish Scenario: Rejection from resistance could lead price back toward the major support zone. ⚠️ Trade with proper risk management and wait for confirmation before entering


BTCUSD 目前没有其他交易策略
前往图表与交易思路