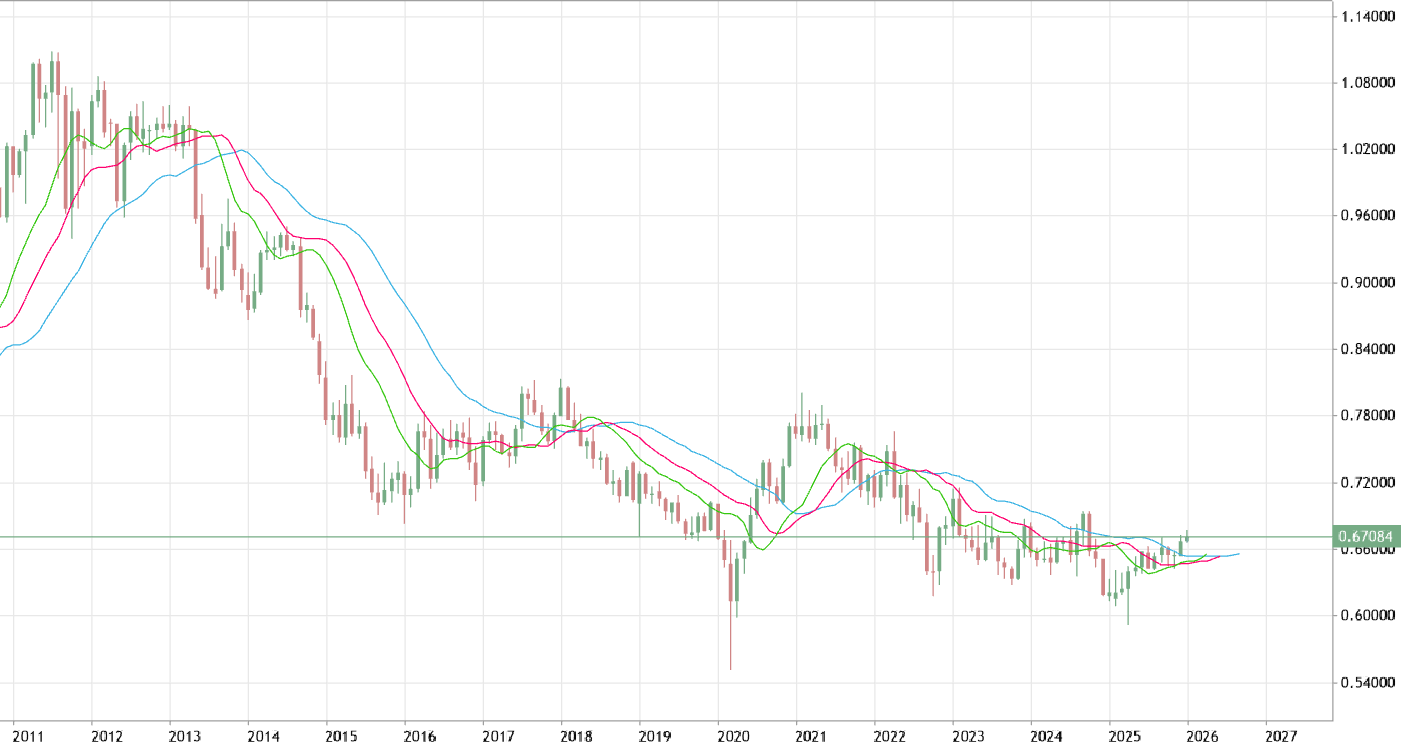
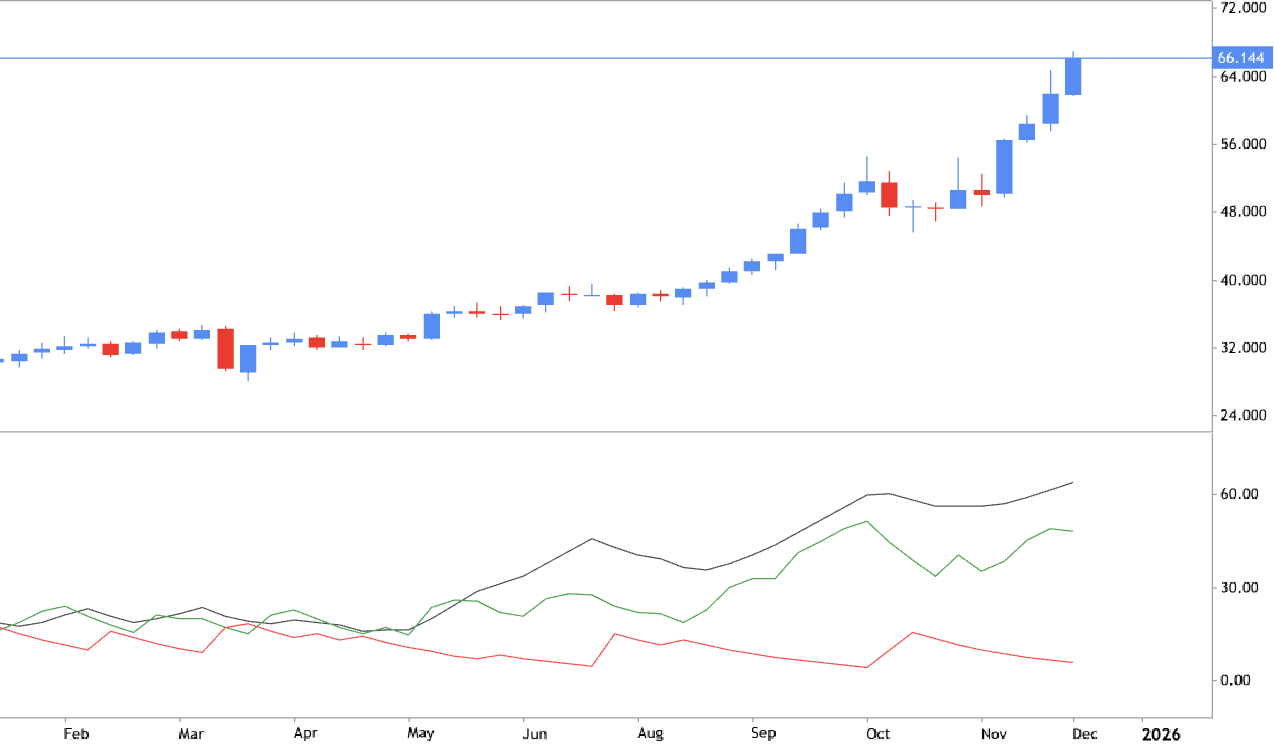
概述
Trend following: Moving Averages indicator to open the positions on the direction of the primary trend
Moving averages indicator is commonly used for estimation of the primary trend as well as the secondary correction and bear market rally for example. Traders choose the moving average period depending on the type of trading they do: short-term, medium-term or long-term. Short-term: 10 -55 period Moving Average (11 and 55 are usually used on lower timeframe). Medium-term: 55 - 100 period Moving Average (or the combination of 55 SMA together with 100 SMA). Long-term: 100 - 200 period Moving Average (or the combilation of 100 MA together with 200 MA). This indicator is providing the good view related to the market condition with all the aspects of the situation together with the possible entry points by using the well-known combinations of 2 or 3 indicators on one chart for example. 0
Bollinger Bands - indicator with lot of information for traders
Bollinger Bands indicator was developed by John Bollinger, and this indicator is providing a lot of information, for example: about low volatility- consolidation phase, periods of high volatility- extended trends, support/resistance and buy/sell entry points. The middle line is a simple moving average, the upper line = middle line + standard deviation, lower line = middle line - standard Deviation. Narrowing of Bands is a sign of consolidation and is known as the Bollinger band squeeze, and when the Bollinger Bands display narrow standard deviation it is usually a time of consolidation. The widening of Bands is a sign of a breakout and is known as the Bulge. So, many traders are using this indicator to estimate the market condition on the current timeframe to decide about buy or sell position to be taken for their personal strategy for example. 0
Market condition evaluation by using two SMA indicators
One of the main problem for the traders is about how to estimate the Market condition in simple (but effective) way. And this moethod is really great: just plot two SMA indicators with the period of 100 and 200, and after that - look at the chart: if those two indicator is on uptrend and the price is above the two indicator so it is primary bullish market condition; opposite - for bearish trend. But if the price is located between those two indicator so it is secondary ranging condition, means: waiting for direction. It is really simply but effective method to estimate the market condition in the beginning of the trading session for example. 0
MACD: entry points estimating
MACD is very universal indicator which can not used for trading because this indicator is estimating the entry points for buy and sell (on M5 or M15 timeframe). Besides, we may use this indicator for trade confirmation to determing about the following: will our trade go on the direction of the primary trend on H4 timeframe (for example) or not. Many traders are using MACD to estimate the primary direction in the beginning of the trading sesssion which help them a lot take some part of the primary trend onto the profit for example. 0