
Accelerator oscillator - traditional general approach
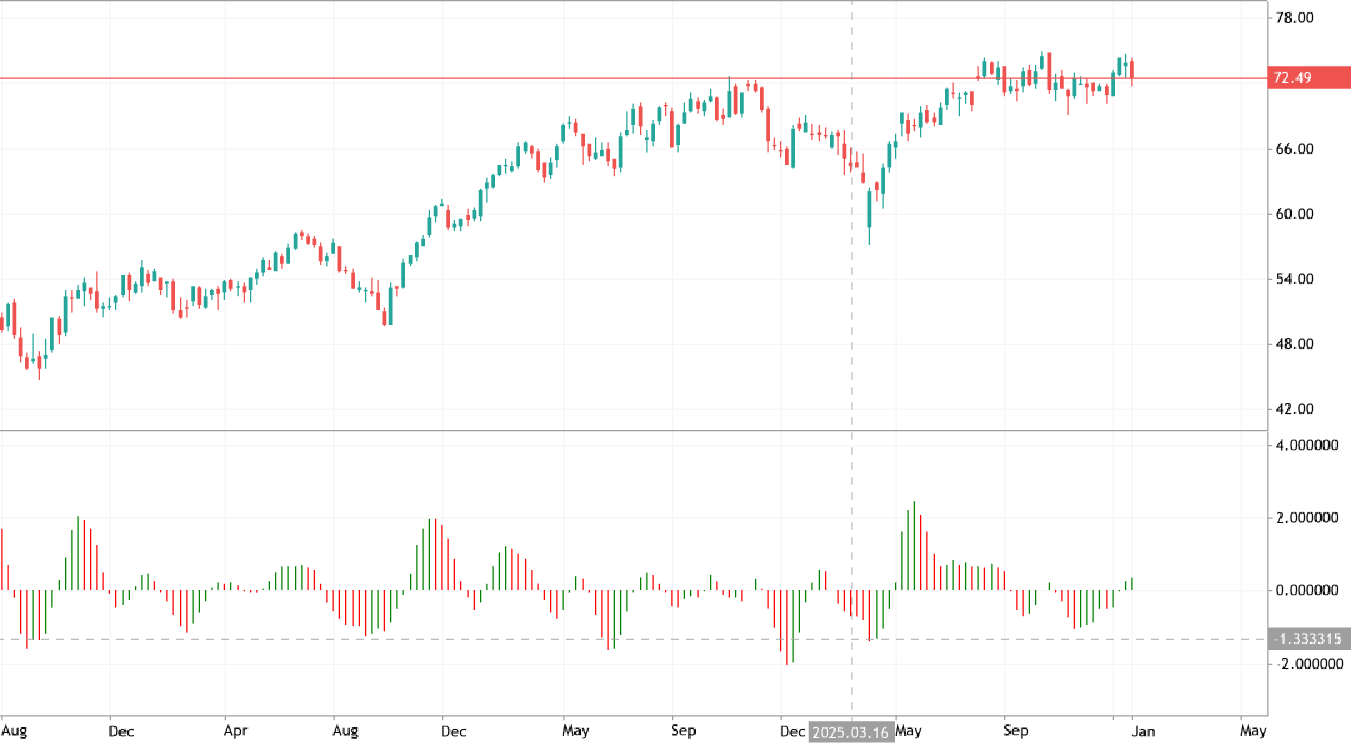
The Accelerator Oscillator measures the difference between the Awesome Oscillator and the 5-period moving average. The indicator reflects the rate at which the Awesome Oscillator changes to be detected the trend reversals. If the Accelerator Oscillator moves above the zero line so it is considered for the signal to be in upward acceleration to be continuing. Alternatively, if it moves below the zero line so the downward acceleration will continue. Besides, the potential price surge is confirmed by two consecutive green bars with the above the centre line. A potential price decline is confirmed by two consecutive red bars which is below the centre line.
0