
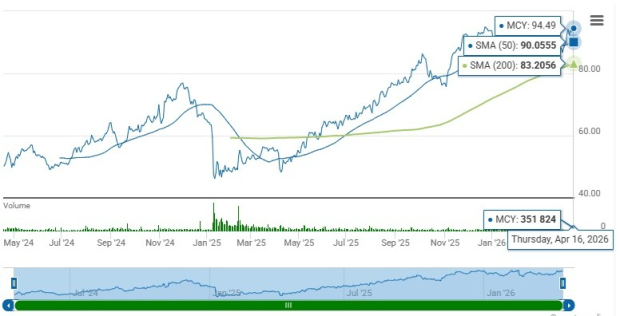
Shares of Mercury General Corporation MCY closed at $94.49 on Thursday, near its 52-week high of $100.06. This proximity underscores investor confidence. It has the ingredients for further price appreciation. The stock is trading above the 50-day and 200-day simple moving averages (SMA) of $90.22 and $83.69, respectively, indicating solid upward momentum. SMA is a widely used technical analysis tool to predict future price trends by analyzing historical price data.
The insurer has a market capitalization of $5.23 billion. The average volume of shares traded in the last three months was 0.2 million.
Image Source: Zacks Investment Research
MCY is an Outperformer
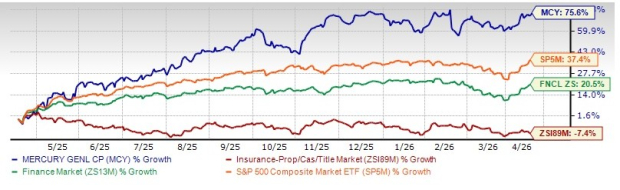
Shares of Mercury General have gained 75.6% in the past year against the industry’s decline of 7.4%. The Finance sector and the Zacks S&P 500 composite have returned 20.5% and 37.4%, respectively.
Mercury General has outperformed its peers, including Axis Capital Holdings Limited AXS, The Travelers Companies, Inc. TRV and Cincinnati Financial Corporation CINF. Shares of AXS, TRV and CINF have gained 6.3%, 16.8% and 23.6%, respectively, in the past year.
Image Source: Zacks Investment Research
MCY’s Growth Projection Encourages
The Zacks Consensus Estimate for Mercury General’s 2026 earnings per share (EPS) indicates a year-over-year increase of 13.9%. The consensus estimate for revenues is pegged at $6.24 billion, implying a year-over-year improvement of 6.1%.
The consensus estimate for 2027 revenues indicates an increase of 5.5% from the corresponding 2026 estimates.
The insurer has a solid surprise history. It surpassed earnings estimates in each of the last four quarters, the average beat being 55%. MCY has an impressive Growth Score of A. This style score helps analyze the growth prospects of a company.
Optimistic Analyst Sentiment on MCY
One analyst covering the stock has raised estimates for 2025, and one analyst has raised the same for 2026 over the past 60 days. Thus, the Zacks Consensus Estimate for 2025 and 2026 moved 7.1% and 3.2% north, respectively, in the last 60 days.
MCY’s Favorable Return on Capital
Return on equity for the trailing 12 months was 20.7%, which compared favorably with the industry’s 7.3%. This reflects its efficiency in utilizing shareholders’ funds.
Return on invested capital in the trailing 12 months was 13.1%, better than the industry average of 5.7%, reflecting MCY’s efficiency in utilizing funds to generate income.
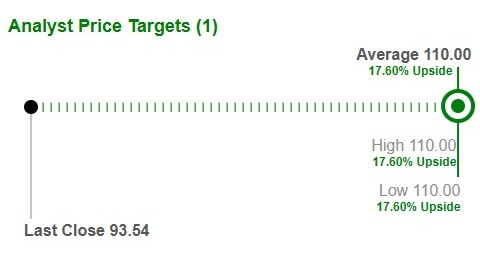
Average Target Price for MCY Suggests Upside
Based on short-term price targets offered by one analyst, the Zacks average price target is $110 per share. The average suggests a potential 17.6% upside from the last closing price.
Image Source: Zacks Investment Research
Factors Driving MCY's Performance
Mercury General has been gaining ground by relying on a set of core organic strengths. Premiums have trended steadily higher, supported by rate increases across insurance lines and a growing base of policies. The Property and Casualty segment has also held up well, signaling a stable backdrop for the company’s operations. These organic drivers are lifting Mercury General’s top line and shaping the path for continued expansion.
Over the past five years, the top line witnessed a compound annual growth rate of 7.6%, supported by higher net premiums earned and other revenues. California remains a key driver, with higher rates in the homeowner’s line and a growing number of auto policies strengthening the company’s premium base.
Net investment income has also played a key role in Mercury General’s growth. Higher average yield combined with higher average invested assets and cash should continue to drive the metric in the long run. Increasing overall market interest rates, as well as higher yields on investments based on floating interest rates, are expected to drive the average annual yield on investments.
Mercury General’s strong liquidity position further supports its growth. With a solid cash balance of $1.3 billion at 2025 end, reflecting an increase of 82.7% year over year, the company believes its cash flow from future operations is adequate to satisfy liquidity requirements. Investment maturities are also available to meet the company’s liquidity needs. The average annual net cash provided by operating activities for the past 10 years was approximately $468 million, and cash generated from operations was sufficient to meet the liquidity requirements over this period.
End Notes
Solid performance across its Property and Casualty segment, rate increases, rise in the number of policies written, higher average invested assets and cash, as well as financial flexibility, make Mercury General a strong contender for being in one’s portfolio.
Coupled with favorable estimates, solid growth projections, and higher return on capital, the time appears right for potential investors to bet on this Zacks Rank #1 (Strong Buy) insurer. You can see the complete list of today’s Zacks #1 Rank stocks here.
Mercury General also has a VGM Score of A. Stocks with a favorable VGM Score are those with the most attractive value, best growth and most promising momentum compared with peers. Back-tested results show that stocks with a VGM Score of A or B, when combined with a Zacks Rank #1 or 2 (Buy), offer the best opportunities in the value investing space.
#1 Semiconductor Stock to Buy (Not NVDA)
The incredible demand for data is fueling the market's next digital gold rush. As data centers continue to be built and constantly upgraded, the companies that provide the hardware for these behemoths will become the NVIDIAs of tomorrow.
One under-the-radar chipmaker is uniquely positioned to take advantage of the next growth stage of this market. It specializes in semiconductor products that titans like NVIDIA don't build. It's just beginning to enter the spotlight, which is exactly where you want to be.
See This Stock Now for Free >>Want the latest recommendations from Zacks Investment Research? Today, you can download 7 Best Stocks for the Next 30 Days. Click to get this free report
The Travelers Companies, Inc. (TRV): Free Stock Analysis Report
Cincinnati Financial Corporation (CINF): Free Stock Analysis Report
Axis Capital Holdings Limited (AXS): Free Stock Analysis Report
Mercury General Corporation (MCY): Free Stock Analysis Report
This article originally published on Zacks Investment Research (zacks.com).