
The wheat sub-sector (HRW, SRW, and HRS) has taken center stage of late as a new generation of “traders” are introduced to wheat markets via predictive market websites.
Technically, daily and weekly charts of futures contracts are a mess, putting the spotlight on long-term monthly trends for Exchange Traded Funds.
Don’t Miss a Day: From crude oil to coffee, sign up free for Barchart’s best-in-class commodity analysis.
Fundamentally, the more heavily traded SRW market is a conundrum, providing little to no support to long-term bullish technical factors.
As some of you know, I grew up on a smallish farm in south-central/southwest Kansas (the description depends on one’s view of where the western part of the state begins). Knowing I wasn’t going to take over the family farm, for myriad reasons including I wasn’t cut out to drive a tractor from one end of the field to the other, I took my lack of talents into the trading side of the business instead. Eventually, I found myself as the merchandiser for a local grain merchandiser in the central part of the Wheat State (Kansas). And it was this experience, and the frequent nightmares associated with my cash wheat position, that led me to the investment side of the industry. It also taught me the true meaning of wheat’s variety of nicknames including The Cockroach of the Grains Sector and Poverty Grass, as I discussed recently.
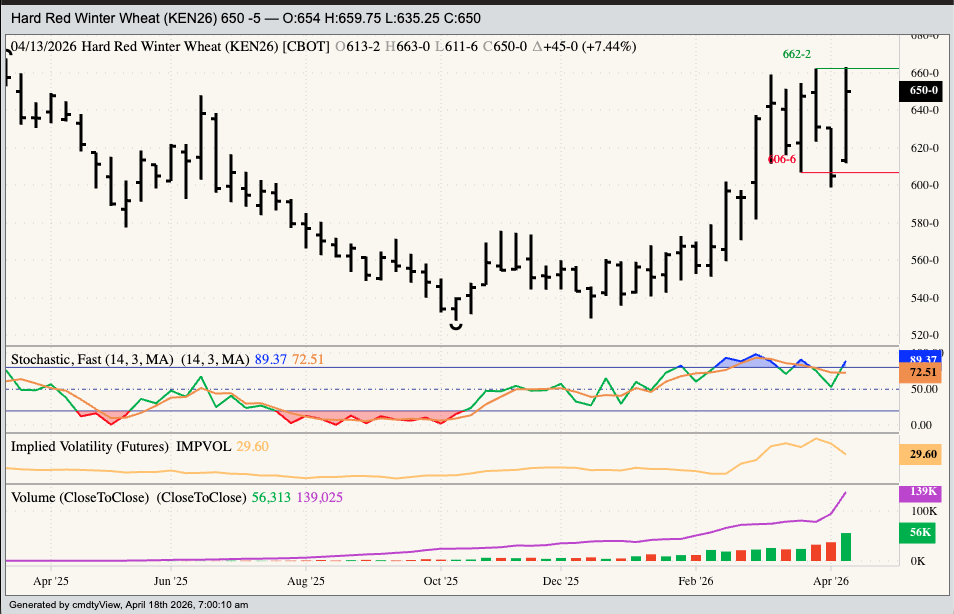
Speaking of my previous piece, the one when I expressed my views on the next generation of “traders” being introduced to wheat through predictive market sites like Kalshi, market action in the new-crop July hard red winter (HRW) ((KEN26) the last two weeks sparked flashbacks to my previously mentioned sleepless nights as a grain merchandiser. Before we dive deeper into the subject, recall another of my recent pieces talked about how to build a “simple” trading system based on new 4-week highs and lows. The idea being old long positions are lifted and shorts established when a new 4-week low is hit, and conversely old short positions are covered and long positions established when a new 4-week high is posted. Keep that in mind, then forget about applying it to wheat.
Why? Because of a little personality quirk the various aspects of the three markets that make up the wheat sub-sector have, a fun little idiosyncrasy I like to call The Head Fake Phenomenon. Over the decades of watching wheat, and occasionally attempting to trade it via cash and/or futures, I've picked up on the markets’ habit of taking out a technical support or resistance point, just enough to trigger possible stop orders placed by the uninitiated, then immediately head back the other direction creating losses before the greenhorn “trader” knows what hit them.
Take a look at the aforementioned weekly chart for the July HRW futures contract. The previous week saw July blow through its previous 4-week low of $6.0675, likely triggering sell stops from the unsuspecting that drove the contract to a low of $5.9875 before closing Friday, April 10 at $6.05, down 26.0 cents for the week. Those new holders of short futures likely spent the weekend toasting their good fortune in discovering the tap-in putt of a market known as wheat on the internet.
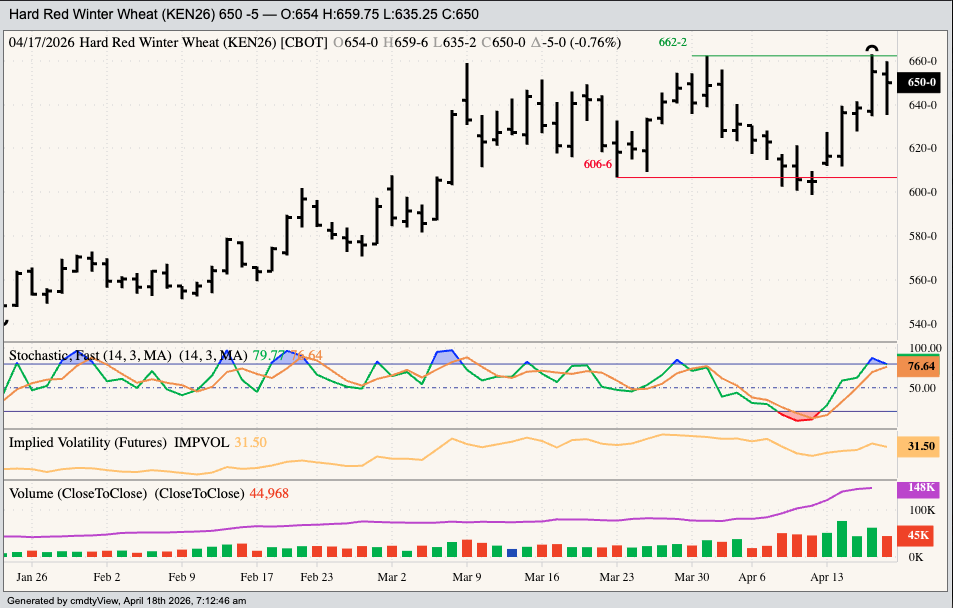
If so, then these same folks would’ve sobered quickly Sunday night when that same July issue opened at $6.1325, up 8.25 cents and leaving a price gap of 3.5 cents with the previous Friday’s high of $6.0975 and putting those new wheat barons immediately in a losing position. As the contract’s daily chart shows, the fun didn’t stop there as July kept rallying by leaps and bounds, hitting a high of $6.63 Thursday (April 16). What was the significance of this? The previous 4-week high was $6.6225 meaning buy stops covering the short positions would’ve been hit creating a loss of roughly 56.0 cents per bushel or $2,800 per 5,000-bushel contract. Welcome to the world of trading Poverty Grass folks.
Where does the market go next? Who knows. After closing last Friday at $6.50, up 45.0 cents for the week but down 13.0 cents from its weekly high, the possibility of a second head fake is strong, but so is a return of buying interest. In other words, the market could go down or up. And that my friends, is the type of analysis 40-plus years of trying to outguess the wheat sub-sector gives us.
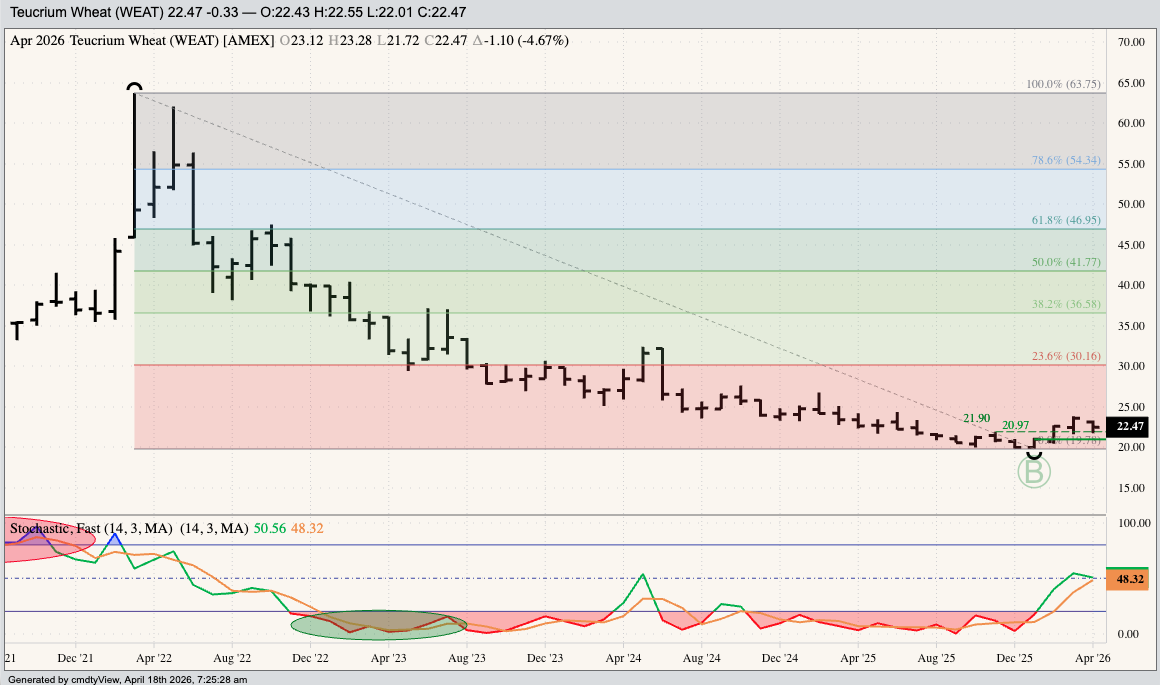
Which is why I’ve set aside my Goldilocks Principle (Daily charts are too hot, monthly charts are too cold, but weekly charts are just right), particularly with the wheat sub-sector, and focused my investment attention on a long-term Exchange Traded Fund (ETF) position. A look at the monthly chart for Teucrium (WEAT) and we see the ETF completed a bullish key reversal this past January confirming a move to major (long-term) uptrend. Theoretically, investors might’ve bought near the January settlement of $20.97, with WEAT closing this past March (2026) at $23.57, a gain of roughly 12.4%. Not bad for a couple months’ time and avoiding the headaches that come with holding futures and/or cash positions.
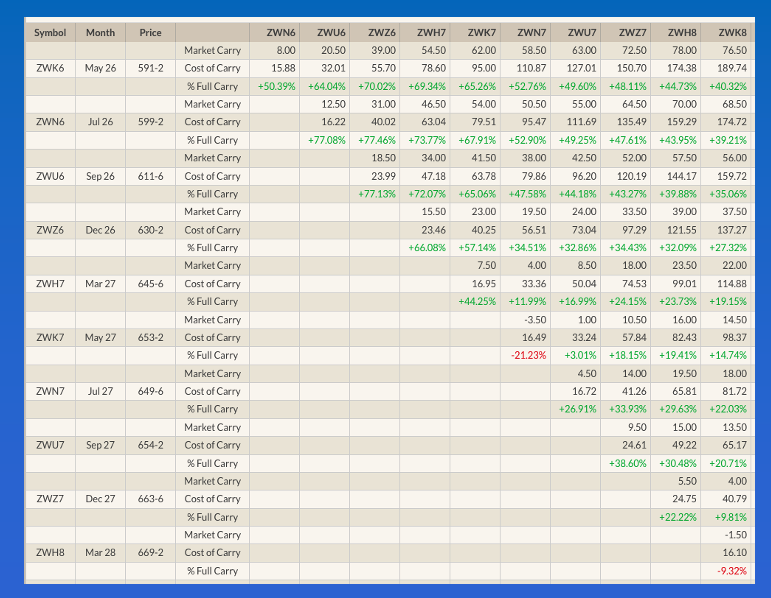
Do market fundamentals support this long-term investment position? No, but as we see in so many other markets, fundamentals don’t seem to matter all that much these days. (Goodbye Market Rule #6: Fundamentals win in the end. You were useful for decades.) Keep in mind the WEAT ETF is based on SRW futures, so we need to switch gears a bit from our earlier look at HRW futures. Fundamentally, SRW is a conundrum (a problem admitting of no satisfactory solution). New-crop July-September and September-December futures spreads, as well as the July-May 2026 forward curve are covering a bearish level of calculated full commercial carry beyond 70%. But this comes with an asterisk given carry is being calculated using the CME’s lower Variable Storage Rate of 16.5/100s of one cent per bushel per day (approximately 5 cents per bushel per month) as compared to the higher rate of 26.5/100s of one cent per bushel per day (approximately 8 cents per bushel per month) still used in HRW.
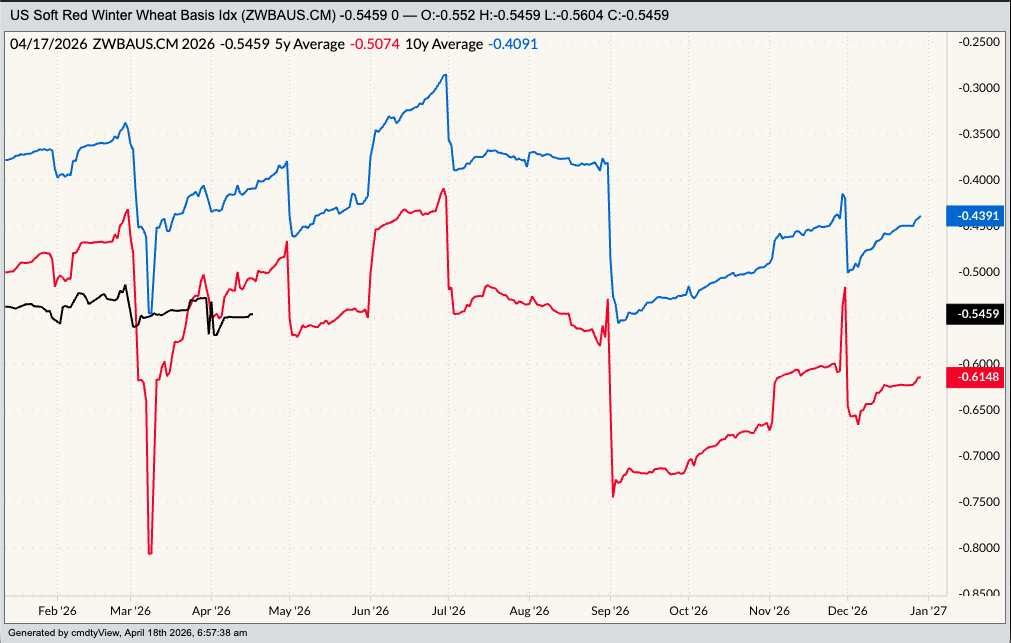
Our other read on real fundamentals remains bearish as national average basis continues to run below previous 5-year and 10-year daily averages. In other words, the basis market remains weak, and as I discussed in a recent piece on Brent crude oil, this tells us there is plenty of immediate supply in relation to demand.
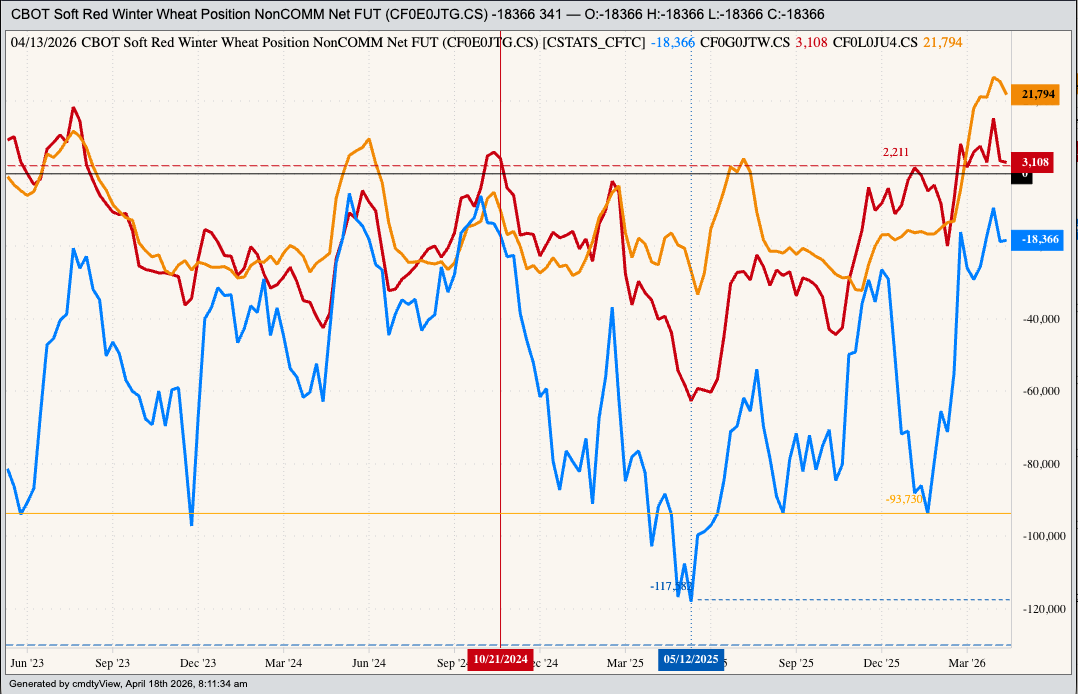
Why would long-term investors be long the WEAT ETF then? Watson – my name for the algorithm-driven global trading industry – is not a rational human being who understands wheat. Based on technical factors like momentum and volatility computers could continue to buy SRW based on headlines tied to completely made-up government numbers (e.g. NASS’ weekly crop condition figures). If so, funds could continue to cover the net-short futures position with the most recent Commitments of Traders report (legacy, futures only) showing 18,366 contracts as of Tuesday, April 14, a decrease of 341 contracts from the previous week.
Let’s see how all this plays out. It should be fun.
On the date of publication, Darin Newsom did not have (either directly or indirectly) positions in any of the securities mentioned in this article. All information and data in this article is solely for informational purposes. For more information please view the Barchart Disclosure Policy here.
More news from Barchart
Is Wheat a Good Long-Term Investment? How Much Higher Can Wheat Prices Go in April? Why Are Fridays in the Commodity Complex Easy to Predict? What a New Generation of Traders in Commodities Might Mean For Markets