


Although the BTC price has remained near a key support zone, recent chart signals and Strategy's sale of a portion of its Bitcoin holdings have tempered bullish sentiment in the short term.
At the same time, blockchain data points to growing network participation, suggesting that user activity has continued to strengthen despite the recent market pullback. The contrast between improving on-chain metrics and weakening technical signals has become a key focus for investors evaluating Bitcoin's near-term direction .
Strategy's Bitcoin Sale Adds to Market Caution
Crypto analyst Ali Martinez , known online as Ali Charts, reported that Bitcoin recently flashed a TD Sequential "9" sell signal on the 12-hour chart, a technical pattern that traders often associate with trend exhaustion following an extended rally.
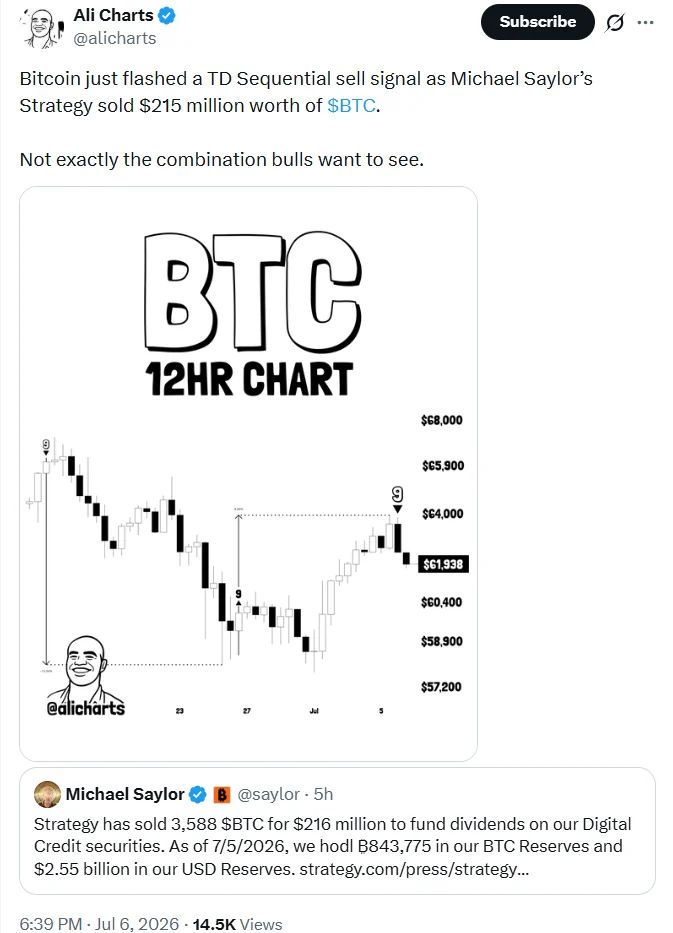
Bitcoin flashed a TD Sequential sell signal as Strategy sold 3,588 BTC worth $216 million to fund dividend payments, adding to near-term bearish sentiment. Source: Ali Martinez via X
The signal coincided with Strategy's sale of approximately 3,588 BTC, valued at around $215 million to $216 million. According to the company, the transaction was carried out to fund dividend payments tied to its Digital Credit securities rather than to reduce its long-term exposure to Bitcoin.
Commenting on the development, Ali Charts wrote:
"Bitcoin just flashed a TD Sequential sell signal as Michael Saylor's Strategy sold $215 million worth of BTC. Not exactly the combination bulls want to see."
Despite the sale, Strategy remains firmly committed to its Bitcoin treasury strategy . The company continues to hold roughly 843,775 BTC alongside approximately $2.55 billion in cash reserves, indicating that the latest transaction was primarily a liquidity management decision rather than a shift in corporate investment strategy.
Rising Active Addresses Reflect Healthy Network Participation
While technical indicators have become more cautious, on-chain data presents a more constructive picture for the Bitcoin market cap leader.
According to Glassnode data shared by Ali Charts , Bitcoin's daily active addresses increased by around 9% to more than 660,000 between late June and early July. Daily active addresses measure the number of unique wallet addresses participating in transactions over a 24-hour period and are widely viewed as an indicator of genuine network usage.
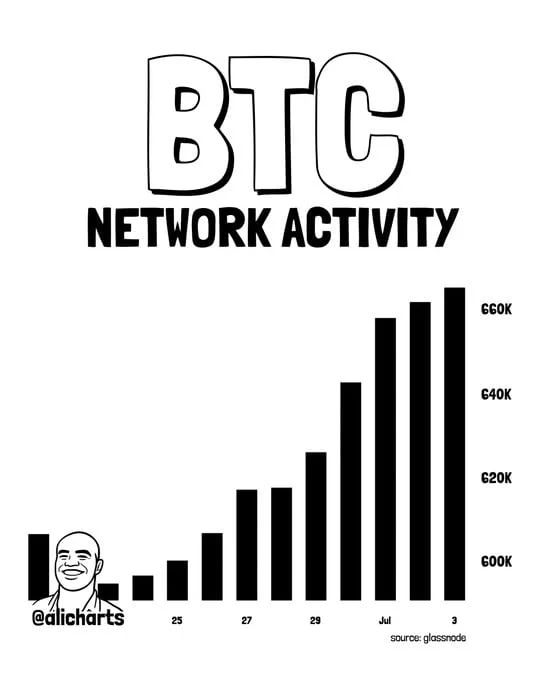
Bitcoin's daily active addresses climbed 9% to more than 660,000, signaling stronger network participation despite recent market weakness. Source: @alicharts via X
Unlike derivatives trading volumes or large transfers by institutional investors, this metric provides a broader view of user participation across the Bitcoin network. Although rising active addresses do not necessarily translate into immediate price appreciation, sustained growth in network activity is often considered a positive sign for long-term adoption and overall market health.
The increase in user engagement suggests that interest in Bitcoin remains resilient even as short-term price action becomes more volatile.
Bitcoin Price Today Shows Mixed Technical Picture
According to TradingView data for BITSTAMP:BTCUSD, Bitcoin price today was trading around $62,013, down approximately 2.48% during the latest session.
TradingView's overall technical summary remains Neutral, although the underlying signals lean toward caution. Of the indicators tracked by the platform, 12 currently issue sell signals, nine remain neutral, and five point toward buying opportunities.
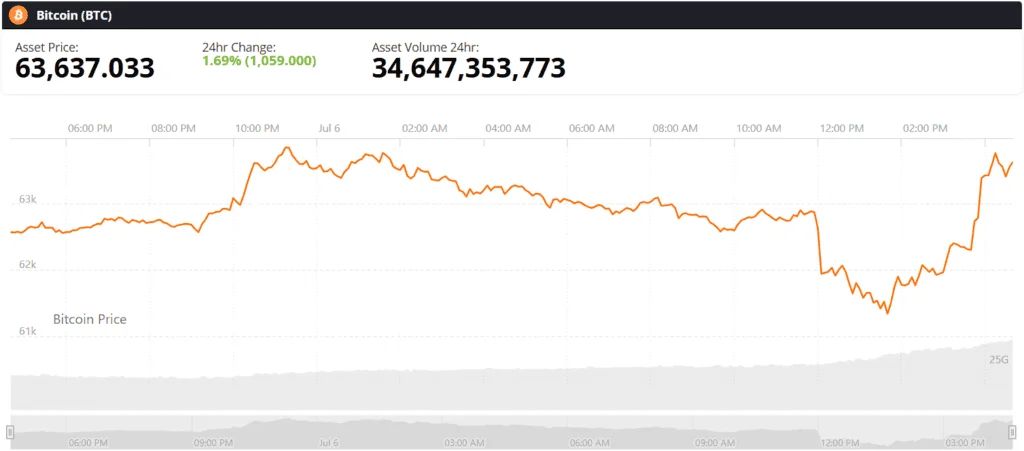
Bitcoin (BTC) was trading at around $63,637, up 1.69% in the last 24 hours at press time. Source: Bitcoin price via Brave New Coin
Momentum indicators largely reflect a market lacking strong directional conviction. The Relative Strength Index (RSI) stands at 46, comfortably within neutral territory and indicating that Bitcoin is neither overbought nor oversold. The Average Directional Index (ADX) reads 30, suggesting a moderate trend, while the Stochastic %K sits at 70, pointing to improving momentum without signaling excessive buying pressure.
Elsewhere, the MACD continues to generate a buy signal despite remaining below zero at -1,117, hinting that bearish momentum may be easing. However, the Momentum indicator and Bull Bear Power continue to favor sellers, highlighting that caution remains warranted until stronger confirmation emerges.
Overall, the oscillator readings suggest that Bitcoin is in a period of equilibrium rather than approaching an immediate breakout or breakdown.
Moving Averages Continue to Present Resistance
While short-term averages continue to offer nearby support, Bitcoin remains below several important medium- and long-term moving averages that continue to define the broader trend.
The 10-period EMA at 61,831 and the 10-period SMA at 61,069 remain supportive of the current trading range. However, resistance begins to emerge around the 20-period EMA at 62,303 and becomes more pronounced near the 30-period EMA at 63,419 and the 50-period EMA at 65,641.
The longer-term picture remains more challenging. Bitcoin is still trading well below the 100-period EMA at 69,385 and the 200-period EMA at 75,510, indicating that the broader corrective phase has yet to fully reverse.
Additional indicators reinforce the balanced outlook. The Ichimoku Base Line is positioned near 62,494, reflecting equilibrium, while the 20-period Volume Weighted Moving Average (VWMA) at 61,522 continues to provide nearby support. Meanwhile, the Hull Moving Average maintains a sell signal around 63,790, underscoring the resistance overhead.
Bitcoin Price Prediction: Key Levels to Watch
From a technical standpoint, the current Bitcoin price prediction remains balanced, with both bullish and bearish factors influencing the market.
TradingView places the Classic Pivot Point near 63,515, making it an important resistance level for traders in the near term. A sustained move above the $62,500-$63,000 region, accompanied by an RSI climbing above 50 and continued improvement in the MACD, could strengthen bullish momentum and shift attention toward the $63,500-$65,000 resistance zone.
On the downside, failure to maintain current support levels could expose Bitcoin to additional selling pressure, particularly if bearish technical signals continue to build.
For now, the market presents a mixed outlook. Growing on-chain activity, highlighted by the rise in daily active addresses, points to healthy network participation, while technical indicators continue to signal caution . Whether stronger network fundamentals can outweigh bearish chart patterns will likely depend on Bitcoin's ability to reclaim nearby resistance levels and attract renewed buying interest in the sessions ahead.