


Truist Financial’s TFC second-quarter 2026 earnings of $1.23 per share handily beat the Zacks Consensus Estimate of $1.08. The bottom line was up 36.7% from 90 cents a year ago.
Shares of TFC lost 1.2% in pre-market trading despite better-than-expected quarterly performance on net interest margin concerns.
Results were primarily aided by a rise in net interest income (NII) and higher fee income. A higher average loan and deposit balance, as well as a decline in provisions, offered support. An increase in expenses and a decline in NIM were the undermining factors.
Net income available to common shareholders was $1.52 billion, up 28.7% from the prior-year quarter.
TFC’s Revenue Mix Reflects Higher Fee Income
Total revenue of $5.27 billion rose 5.6% year over year. The top line beat the consensus estimate of $5.21 billion.
NII was $3.62 billion compared with $3.59 billion in the second quarter of 2025. This was driven by higher earning assets and loan growth, partly offset by lower loan spreads and fixed-rate debt repricing. The net interest margin (NIM) contracted 4 basis points (bps) to 2.98%.
Non-interest income was $1.64 billion, up 17.4%. This was attributable to higher investment banking and trading income, wealth management income, mortgage banking income and lending-related fees.
Truist Cost Trends Show Mixed Signals on Profitability
Non-interest expense totaled $3.06 billion, up 2.3%. This was primarily due to higher personnel costs related to salaries and incentives, partly offset by lower professional fees and outside processing expenses.
Profitability metrics improved alongside earnings growth. Return on average common equity was 10.4% and return on average tangible common equity was 15.4% in the quarter compared with 8.1% and 12.3%, respectively, in the prior-year period.
The efficiency ratio improved to 58% from 59.9%, signaling better operating leverage.
TFC’s Credit Quality: A Mixed Bag
Provision for credit losses decreased to $395 million from $488 million a year ago, reflecting an allowance release in the reported quarter. The allowance for loan and lease losses was 1.51% of loans and leases held for investment, down from 1.54% a year ago.
Net charge-offs (NCOs) were $414 million, up from $396 million in the year-ago quarter. NCO ratio of 0.50% of average loans and leases increased 1 bp year over year.
Total non-performing assets were $1.75 billion as of June 30, 2026, up from $1.32 billion a year earlier. Non-performing loans and leases were 0.51% of loans and leases held for investment, up 12 bps year over year.
TFC’s Balance Sheet and Capital Return Remain in Focus
Balance sheet trends were solid, with average loans and leases of $331.75 billion, up from $313.84 billion in the year-ago quarter. This was driven by commercial and industrial, commercial real estate and other consumer loan growth.
Average deposits were $404.87 billion compared with $400.48 billion a year earlier.
Capital return was a notable highlight in the quarter. Truist returned $1.8 billion to shareholders through dividends and share repurchases, including $1.2 billion of buybacks. The company expects share repurchases to be approximately $5 billion in 2026.
The common equity Tier 1 ratio was 10.9% at quarter end, up 10 bps sequentially but down from 11% a year ago.
TFC Projects Upbeat Near-Term Results
For the third quarter of 2026, management expects taxable-equivalent (TE) revenues to increase roughly 1% sequentially. Non-interest expenses are projected to rise almost 2% from $3.1 billion.
For full-year 2026, Truist expects revenues (TE) to rise 3.5-4% and non-interest expenses to increase roughly 1.75%. The company also estimates NCO ratio of approximately 55 bps and an effective tax rate of about 14.5%.
Management expects NII to increase 1-1.5% in 2026 from the prior year. The updated outlook reflects the continued optimization of less strategic lending portfolios, lower loan spreads, a less favorable deposit mix and changes in the forward interest-rate curve.
Our Take on Truist Financial
Decent loan demand, higher fee income and TFC’s business restructuring/expansion initiatives are expected to continue supporting its top line. A solid balance sheet position is another positive. However, elevated expenses, given a tough operating environment, and pressure on NIM are major headwinds.
Truist Financial Corporation Price, Consensus and EPS Surprise
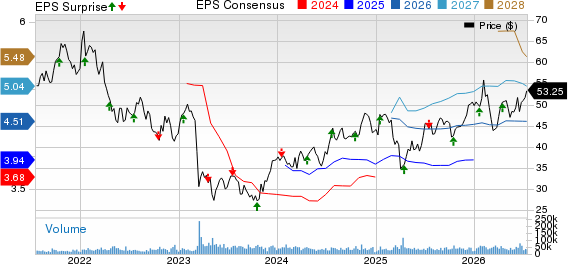
Truist Financial Corporation price-consensus-eps-surprise-chart | Truist Financial Corporation Quote
Truist Financial currently carries a Zacks Rank #3 (Hold). You can see the complete list of today’s Zacks #1 Rank (Strong Buy) stocks here.
Performance of Truist’s Peers
M&T Bank’s MTB second-quarter net operating earnings per share of $5.35 beat the Zacks Consensus Estimate of $4.66. The bottom line compared favorably with earnings of $4.28 in the year-ago quarter.
Results were aided by higher NII and a rise in non-interest income, along with loan growth. However, higher expenses acted as headwinds.
The PNC Financial Services Group, Inc. PNC reported adjusted earnings per share of $4.85 in the second quarter of 2026, beating the Zacks Consensus Estimate of $4.51 and up from $3.85 a year ago.
Results reflected higher NII, strong fee income growth, an improvement in NIM, solid loan growth and lower provisions. However, higher expenses and a decline in the deposit balance were headwinds.
7 Best Stocks for the Next 30 Days
Just released: Experts distill 7 elite stocks from the current list of 220 Zacks Rank #1 Strong Buys. They deem these tickers "Most Likely for Early Price Pops."
Since 1988, the full list has beaten the market more than 2X over with an average gain of +23.9% per year. So be sure to give these hand picked 7 your immediate attention.
See them now >>Want the latest recommendations from Zacks Investment Research? Today, you can download 7 Best Stocks for the Next 30 Days. Click to get this free report
Truist Financial Corporation (TFC): Free Stock Analysis Report
The PNC Financial Services Group, Inc (PNC): Free Stock Analysis Report
M&T Bank Corporation (MTB): Free Stock Analysis Report
This article originally published on Zacks Investment Research (zacks.com).