

Citigroup, Inc. C delivered an impressive second-quarter performance, easily surpassing the Zacks Consensus Estimate, with strong growth in revenues and earnings. Other major banks, including Bank of America BAC and Wells Fargo WFC, also came out with solid quarterly results.
Citigroup generated its highest quarterly revenues of $24.76 billion in a decade, which jumped 14% year over year and topped Zacks Consensus Estimates by more than 4%. More impressively, second-quarter adjusted net income surged 45% on a year over year basis to $5.8 billion. This translated into adjusted earnings per share of $3.15, which crushed the Zacks Consensus Estimate by nearly 16% and climbed more than 60% from the prior year quarter.
Growth was broad-based across the franchise, with investment banking, markets, wealth management, services and consumer banking all contributing to the strong quarter. Citigroup also generated positive operating leverage as revenue growth significantly outpaced expense growth, highlighting that CEO Jane Fraser's multi-year restructuring efforts continue to improve the firm's operating efficiency.
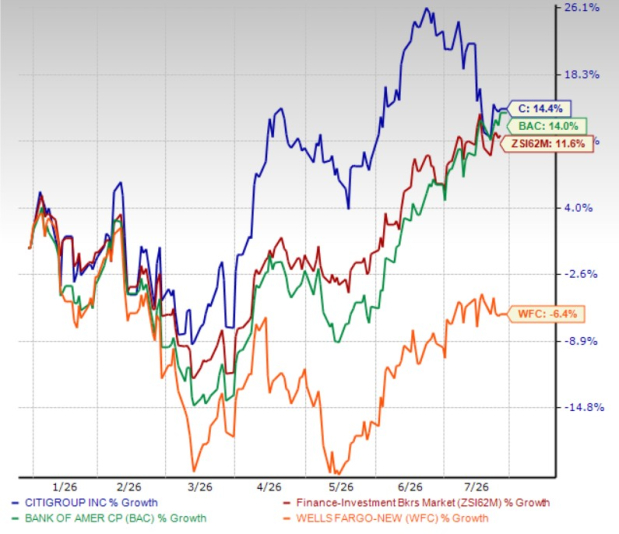
C shares are also experiencing significant momentum, rising 14.4% year to date and outperforming the industry’s growth of 11.6%. Bank of America’s shares have risen 14% while Wells Fargo shares declined 6.4% over the same period.
Price Performance
Image Source: Zacks Investment Research
Most important for investors, significant progress in the ongoing overhaul plan and impressive earnings beat over the past four trailing quarters have prompted analysts to raise their earnings outlook, leading to favorable estimate revisions. Notably, for 2026 and 2027, earnings estimates rose 3.1% and 2.5%, respectively, in the last 30 days, respectively.
Estimate Revision Trend
Image Source: Zacks Investment Research

Citigroup is expected to post 40.8% year-over-year earnings growth this year, followed by a 15% rise in 2027.
Following the blockbuster second-quarter report, a sharp run-up in share price and upward estimate trend, does Citigroup’s stock still offers meaningful upside or if much of the optimism is already reflected in the stock price? To answer this, let us delve deeper and assess C’s investment potential in more detail.
Citigroup’s Performance Catalysts
Strategic Transformation: Citigroup has moved closer to completing its multi-year exit from non-core international consumer banking. The sale of the Polish consumer business in June 2026 marked the final international consumer divestiture apart from remaining wind-downs of Banamex. The company also sold an additional 22.6% stake in Banamex in the second quarter after selling 25% in late 2025. The remaining Banamex deconsolidation and IPO are planned for early 2027, with management expecting the transaction to free up $5 billion in capital.
These transactions follow the completed Russia exit and divestures of consumer franchises across Asia and EMEA. The simpler structure reduces operational complexity, releases capital and allows management to direct resources toward Services, Markets, Banking, Wealth and U.S. Consumer Cards. As the remaining divestitures and wind-downs conclude, lower stranded costs and a more focused allocation of capital should support the path toward higher sustainable returns.
Backed by these initiatives, Citigroup expects revenues, excluding Legacy Franchises and reconciling items, to see a mid-single-digit CAGR from 2025 through 2028. It also aims to achieve a return on tangible common equity (ROTCE) of 10-11% by 2026. C expects to reach 11-13% RoTCE, excluding notable items in 2027 and 2028, and then move toward 14-15% RoTCE over the medium term. This outlook reflects management’s belief that C’s business model is becoming simpler, more efficient and better able to translate revenue growth into shareholder value.
Cost-Optimization Initiatives: The company continues to execute its multi-year cost optimization strategy, centered on workforce rationalization, process simplification, automation and technology investments aimed at enhancing long-term productivity and profitability.
As part of its restructuring program, the company remains on track to eliminate 20,000 positions by the end of 2026. Its total headcount declined to 219,000 as of June 30, 2026, from 230,000 a year earlier. In the first half of 2026, the bank incurred more than $800 million in severance costs, reflecting upfront investments to achieve sustainable operating efficiencies.
Beyond workforce optimization, management is driving efficiency through process simplification, platform consolidation and increased automation, reducing manual touchpoints across operations. At the same time, the company continues to invest in technology and artificial intelligence to strengthen operational resilience, improve productivity and support future revenue growth. To accelerate these initiatives, Citigroup plans to invest an incremental $5 billion between 2026 and 2028, with spending focused on technology modernization, marketing, front-office talent and branch renovations.
Management expects workforce optimization, organizational simplification and technology investments to generate $2-$2.5 billion of annualized cost savings by 2026. The company continues to target a full-year efficiency ratio of 60%. While a portion of these savings will enhance profitability, management intends to reinvest part of the benefits into technology, talent and strategic growth initiatives to support sustainable long-term returns.
Interest Rate Outlook Remains Supportive: NII has been a key contributor to Citigroup’s earnings power and management expects growth to continue amid a shifting rate environment. NII witnessed a three-year CAGR of 6.2% (ended 2025). The uptrend continued in the first half of 2026. Also, the company has been witnessing solid growth in loans and deposit balances.
Though the Federal Reserve is expected to hike the interest rates later this year, Citigroup’s NII will continue to grow, given stabilizing funding/deposit costs and solid loan demand. Management expects NII, excluding Markets, to increase 5-6% in 2026, supported by loan growth and stabilizing funding dynamics.
Liquidity Strength Powers Shareholder Payouts: C enjoys a strong liquidity position. As of June 30, 2026, Citigroup’s cash and due from banks and total investments aggregated to $449.4 billion, lower than its total debt (short-term and long-term borrowing) of $373.3 billion.
Post-clearing the 2026 stress test, the company hiked its dividend 11.7% to 67 cents per share. In the past five years, it has raised its dividends four times. By comparison, Wells Fargo and Bank of America have raised their dividends six and five times, respectively, during the past five years.
Coming back to Citigroup, it maintains a modest payout ratio of 23%, indicating adequate scope to sustain distributions. The company’s annual dividend yield of 1.82% is higher than the industry average, providing investors with a steady income stream while management continues to execute its turnaround strategy.
Citigroup has also remained active in repurchasing shares. The board authorized a $30-billion buyback commitment in June 2026, with no expiry date.
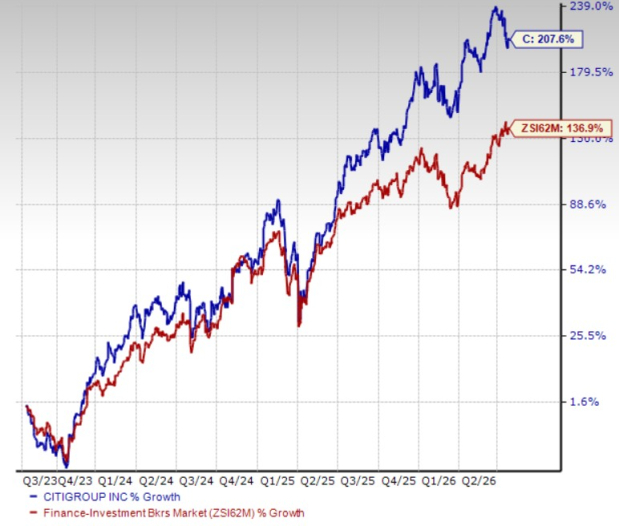
Including dividends, C’s total return over the past three years has been nearly 208% compared with the industry’s average of 136.9%. Thus, the combination of potential capital appreciation, dependable dividend income and continued share repurchases enhances the stock’s total-return prospects. Supported by Citigroup’s robust liquidity and capital levels, its shareholder payout activities appear sustainable.
Total Return Performance
Image Source: Zacks Investment Research
Final View on Citigroup
C’s multi-year transformation is beginning to translate into a stronger earnings profile. The bank’s divestitures, expense-control measures, AI-driven productivity initiatives and increasing focus on higher-return businesses should support revenue growth, operating efficiency and profitability over time. Its solid liquidity position, dividend growth and planned share repurchase further strengthen the investment case.
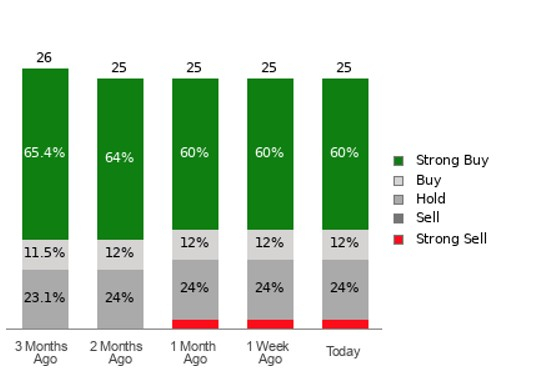
Wall Street sentiment also remains favorable. Citigroup has an average brokerage recommendation of 1.76 on a scale of 1 to 5, wherein 1 represents Strong Buy and 5 represents Strong Sell. Of the 25 brokerage recommendations, 15 are Strong Buy and three are Buy, representing 60% and 12% of the total, respectively. Check price target & stock forecast for Citigroup here>>>
Brokerage Rating Breakdown for C
Image Source: Zacks Investment Research
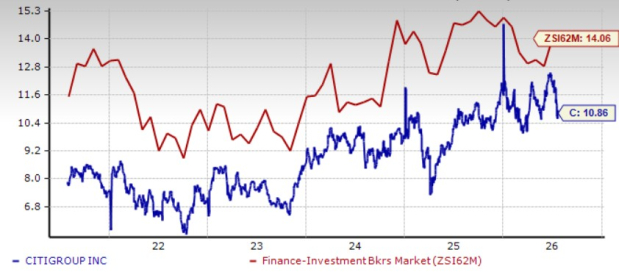
Valuation remains another key positive. Citigroup trades at a forward P/E multiple of 10.86X, below the industry average of 14.06X and its peers Bank of America and Wells Fargo’s multiples of 12.44X and 11.32X, respectively. Citigroup’s discounted valuation despite a sharp increase in share price indicates that the market is still pricing in relatively cautious expectations for its long-term earnings potential.
Price-to-Earnings F12M
Image Source: Zacks Investment Research
This leaves scope for further upside. If management continues to improve returns, control costs and narrow the profitability gap with peers, Citigroup could benefit from both earnings growth and valuation-multiple expansion.
As such, supported by improving fundamentals, disciplined capital returns and favorable analyst sentiment, Citigroup offers an attractive combination of value and growth potential.
Citigroup currently carries a Zacks Rank #2 (Buy). You can see the complete list of today’s Zacks #1 Rank (Strong Buy) stocks here.
Want the latest recommendations from Zacks Investment Research? Today, you can download 7 Best Stocks for the Next 30 Days. Click to get this free report
Citigroup Inc. (C): Free Stock Analysis Report
Bank of America Corporation (BAC): Free Stock Analysis Report
Wells Fargo & Company (WFC): Free Stock Analysis Report
This article originally published on Zacks Investment Research (zacks.com).