

 打开 MQL5 个人资料
图表与思路

SHIP - Long-Term Technical Forecast
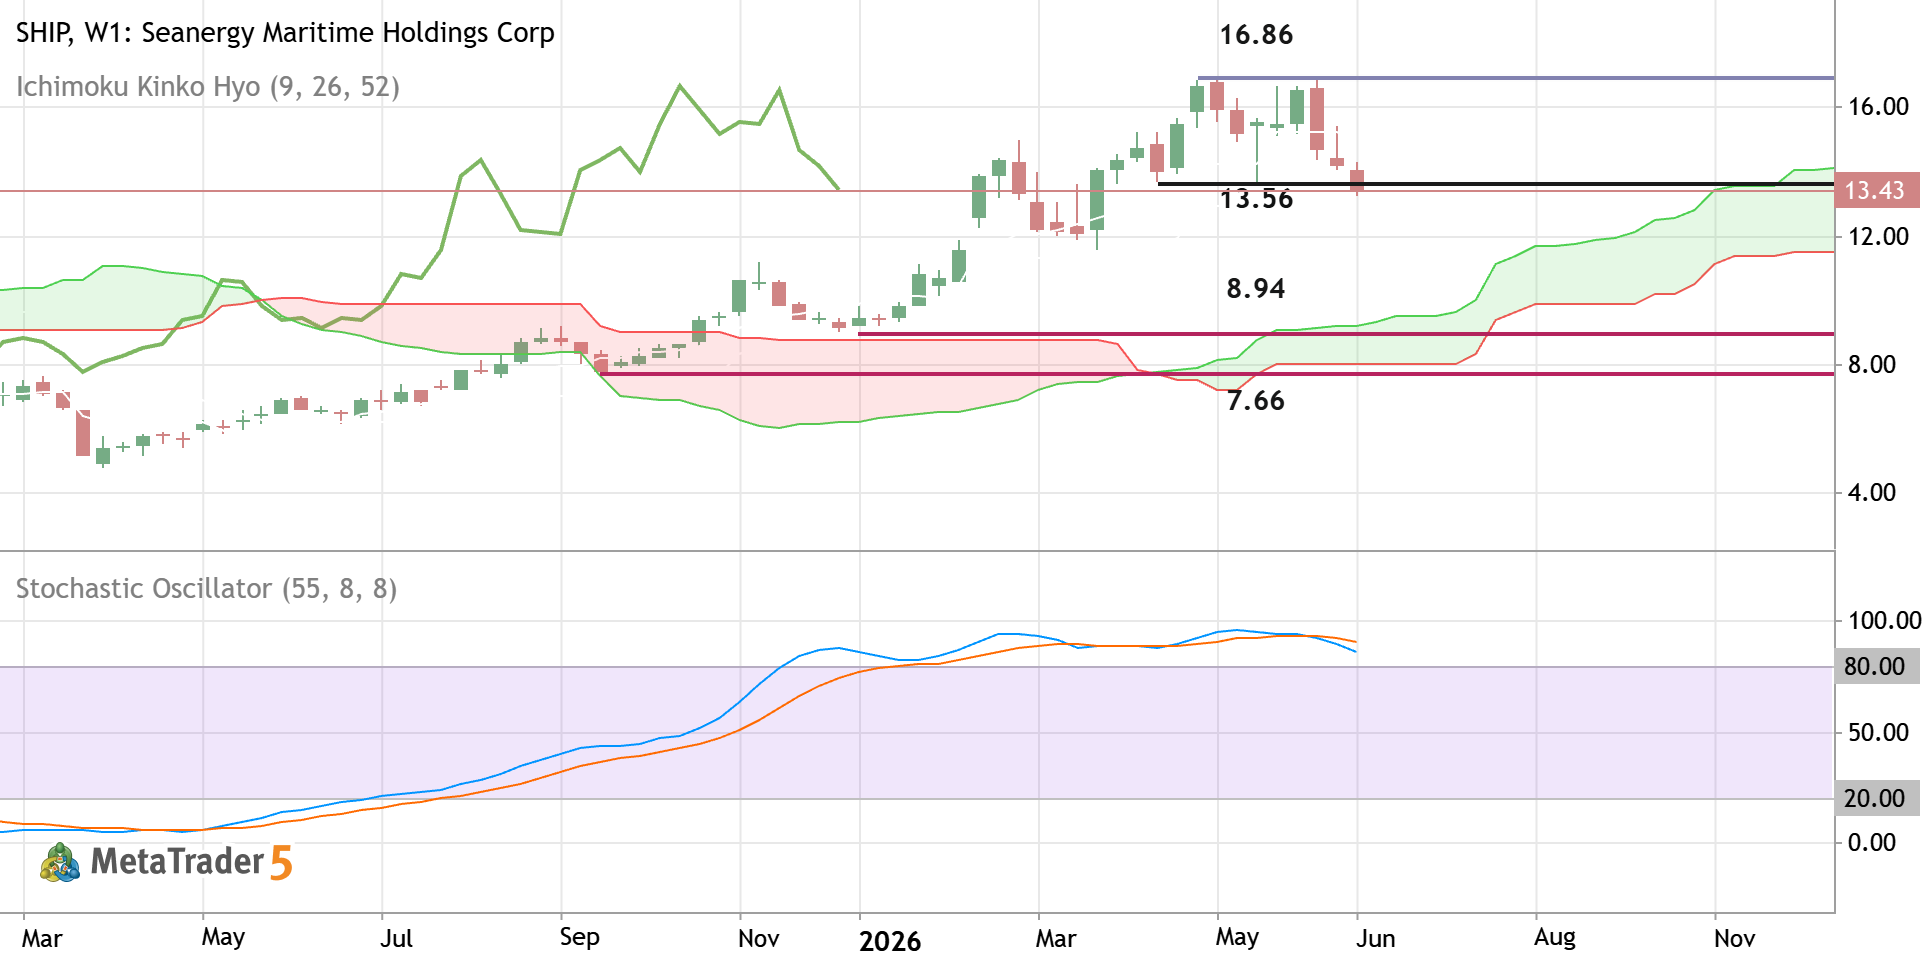
The weekly price is located above Ichimoku cloud in the bullish area of the chart. The price was bounced from support level at 16.86 to below for trying to break the next support level at 13.56 for the secondary correction to be started. If the price breaks the level at 13.56 to below on weekly close bar so we may see the secondary correction within the primary bullish market condition. If the price crosses 8.94 support to below together with the next support level at 7.66 so the primary bearish reversal will be started. Alternatively, the price will be on ranging to be near and above Ichimoku cloud waiting for the direction of the strong trend to be started. Trading Summary : ranging to the secondary correction

BGC - Daily Trading Forecast
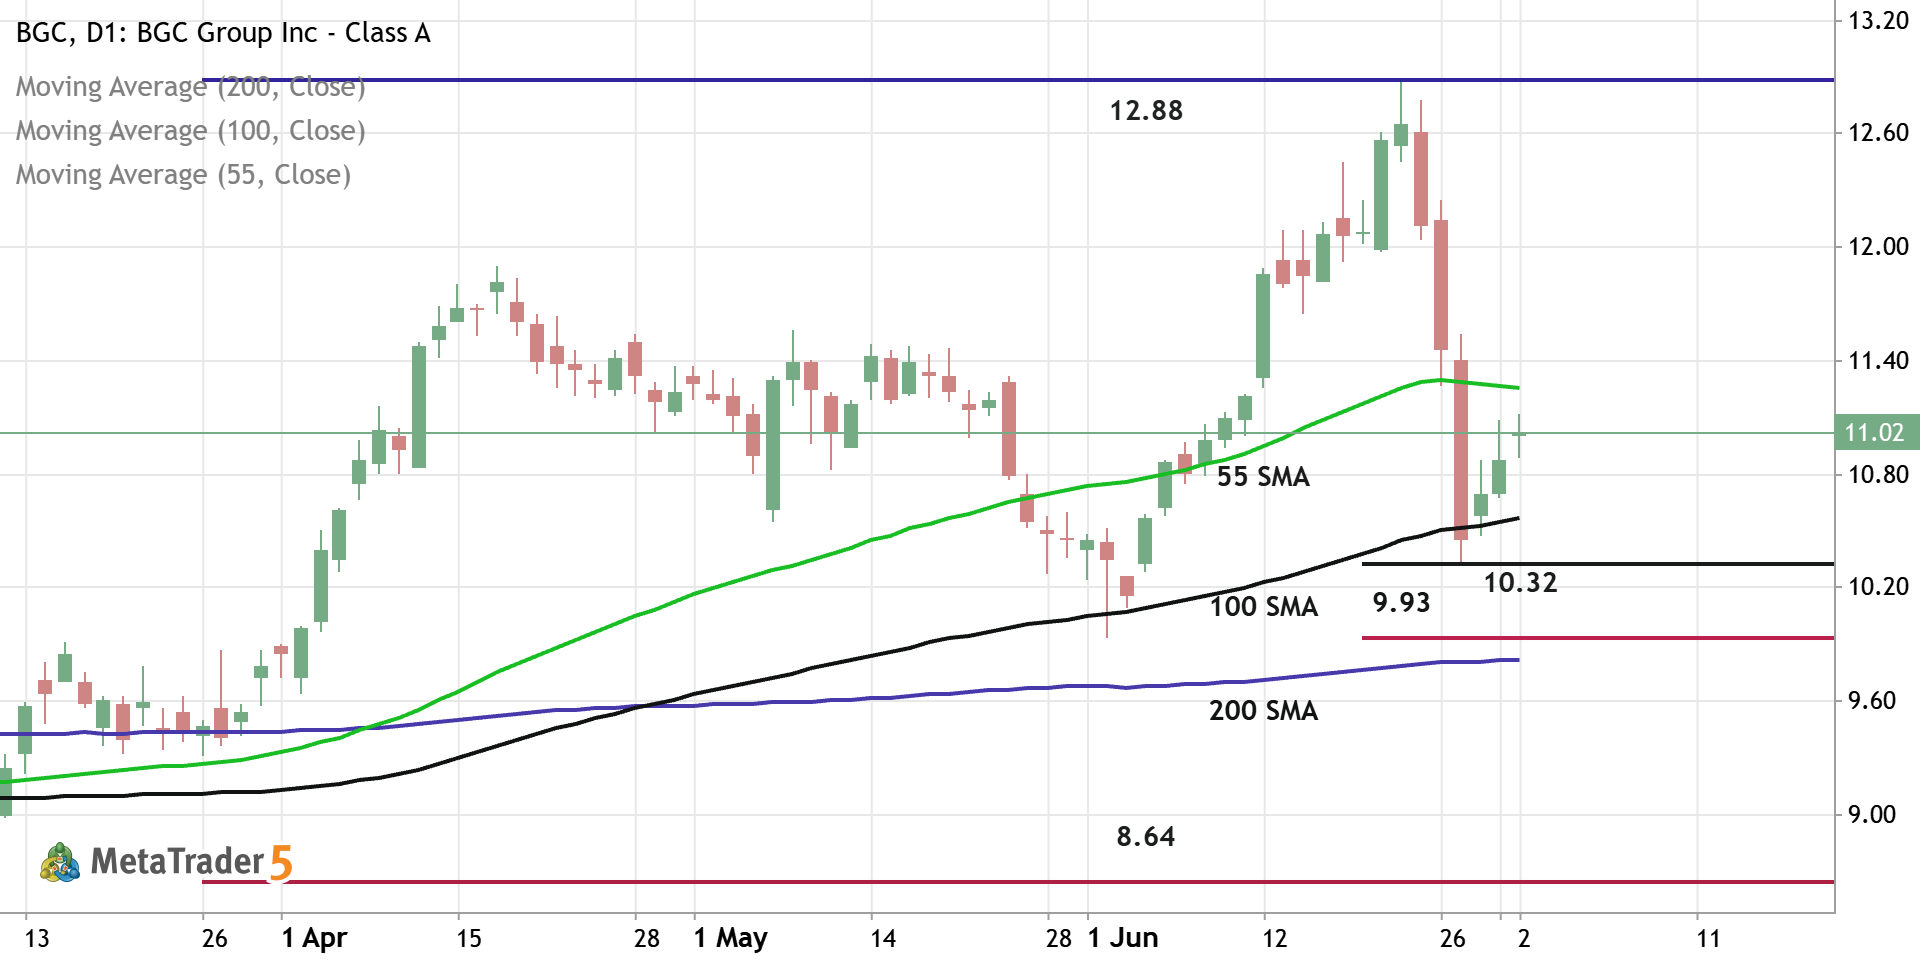
Daily price is located above 200-SMA in the bullish area of the chart. The price was bounced from support level at 10.32 and from 100-SMA to above for the pimary bullish trend to be continuing. If the price breaks 55-SMA to above so the strong bullish trend will be resumed with 12.88 resistance as the global possible target. If the price crosses support level at 9.93 together with 200-SMA to below so the primary bearish reversal will be started with 8.64 support level as the global possible target. Aternatively, the price will be on secondary ranging to be near and above 200 SMA waiting for direction. Trading Summary : waiting for direction

PYPL - Daily Rally to the Possible Bullish Reversal
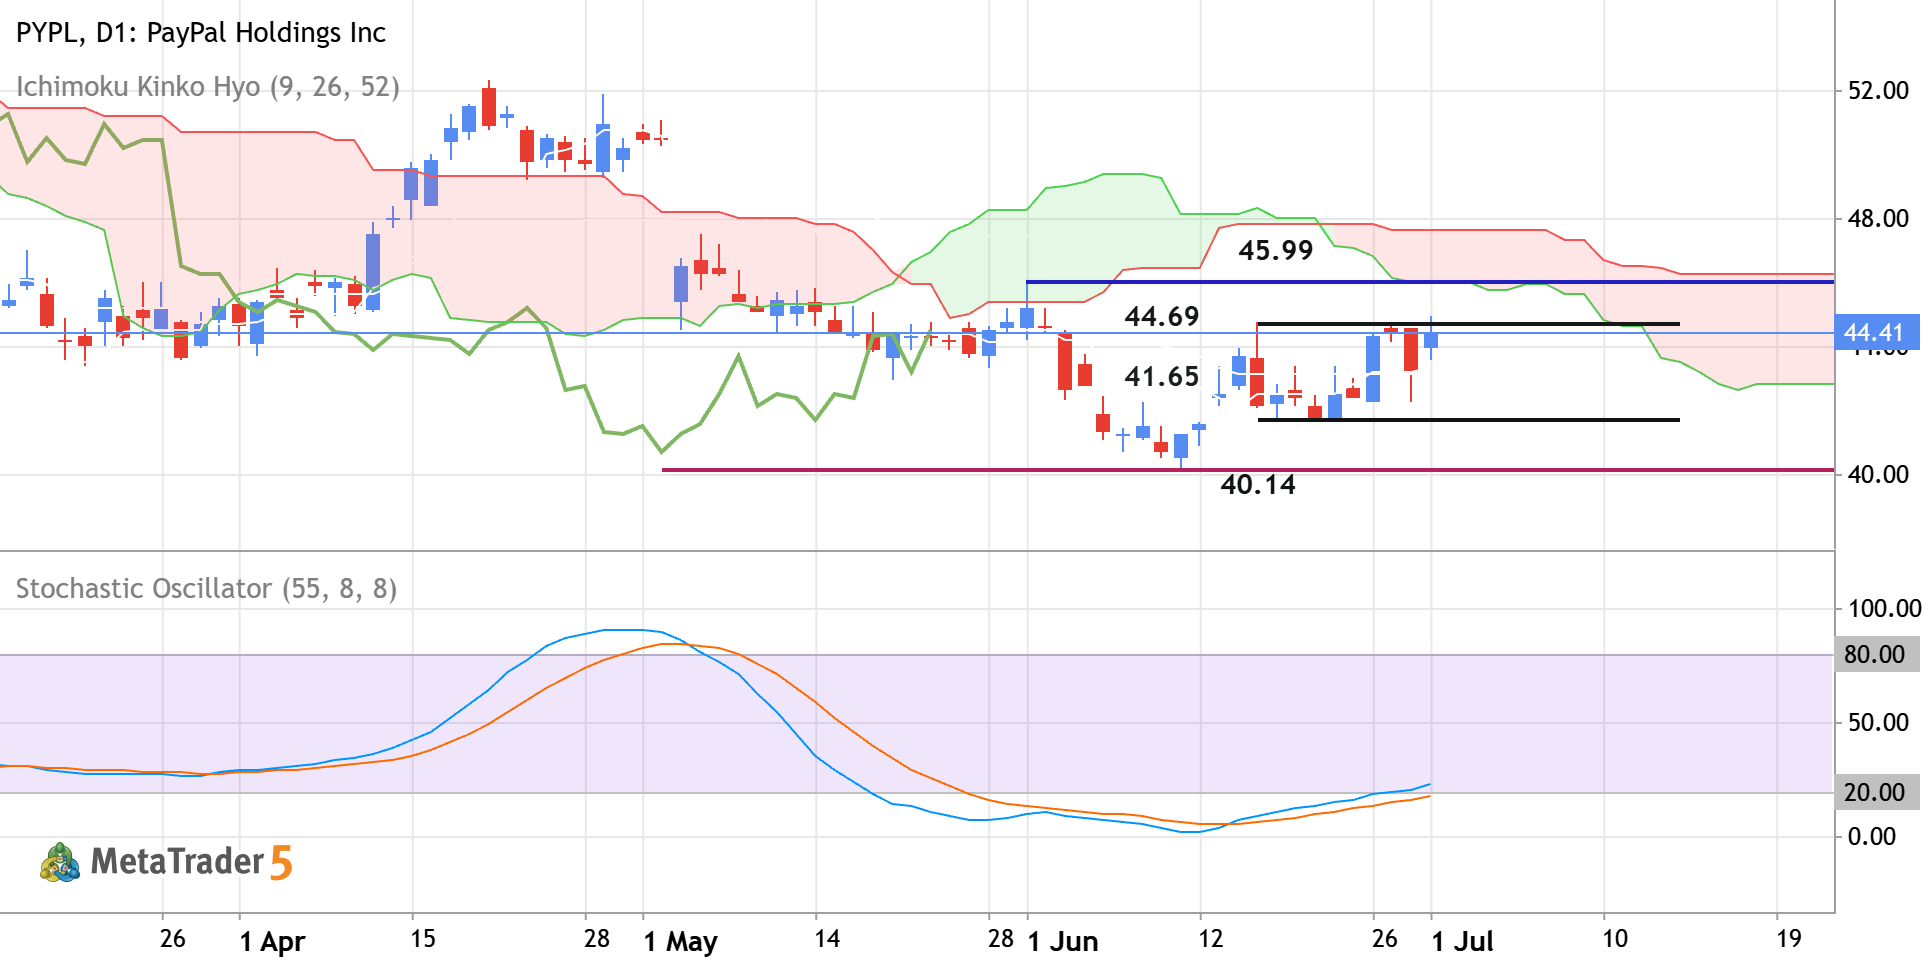
Daily price is located near and below Ichimoku cloud in the bearish area of the chart. The price was blinced from resistance levels at 40.14 and 41.65 to above for the bear market rally to be started. The Stochastic oscillator is showing the possible uptrend in the near future, and Chinkou Span line is crossing historical price but on open daily bar for now. If the price breaks the resistance level at 44.69 to the 45.99 to above so the primary bullish reversal will be started. If the price crosses support at 41.65 together with support level at 40.14 to below so the primary bearish trend will be resumed. Alternatively, the price will be on secondary ranging within the primary bearish trend to be near and below Ichimoku cloud waiting for direction of the strong trend to be started. Trading
USDIND - Daily Ranging for Direction
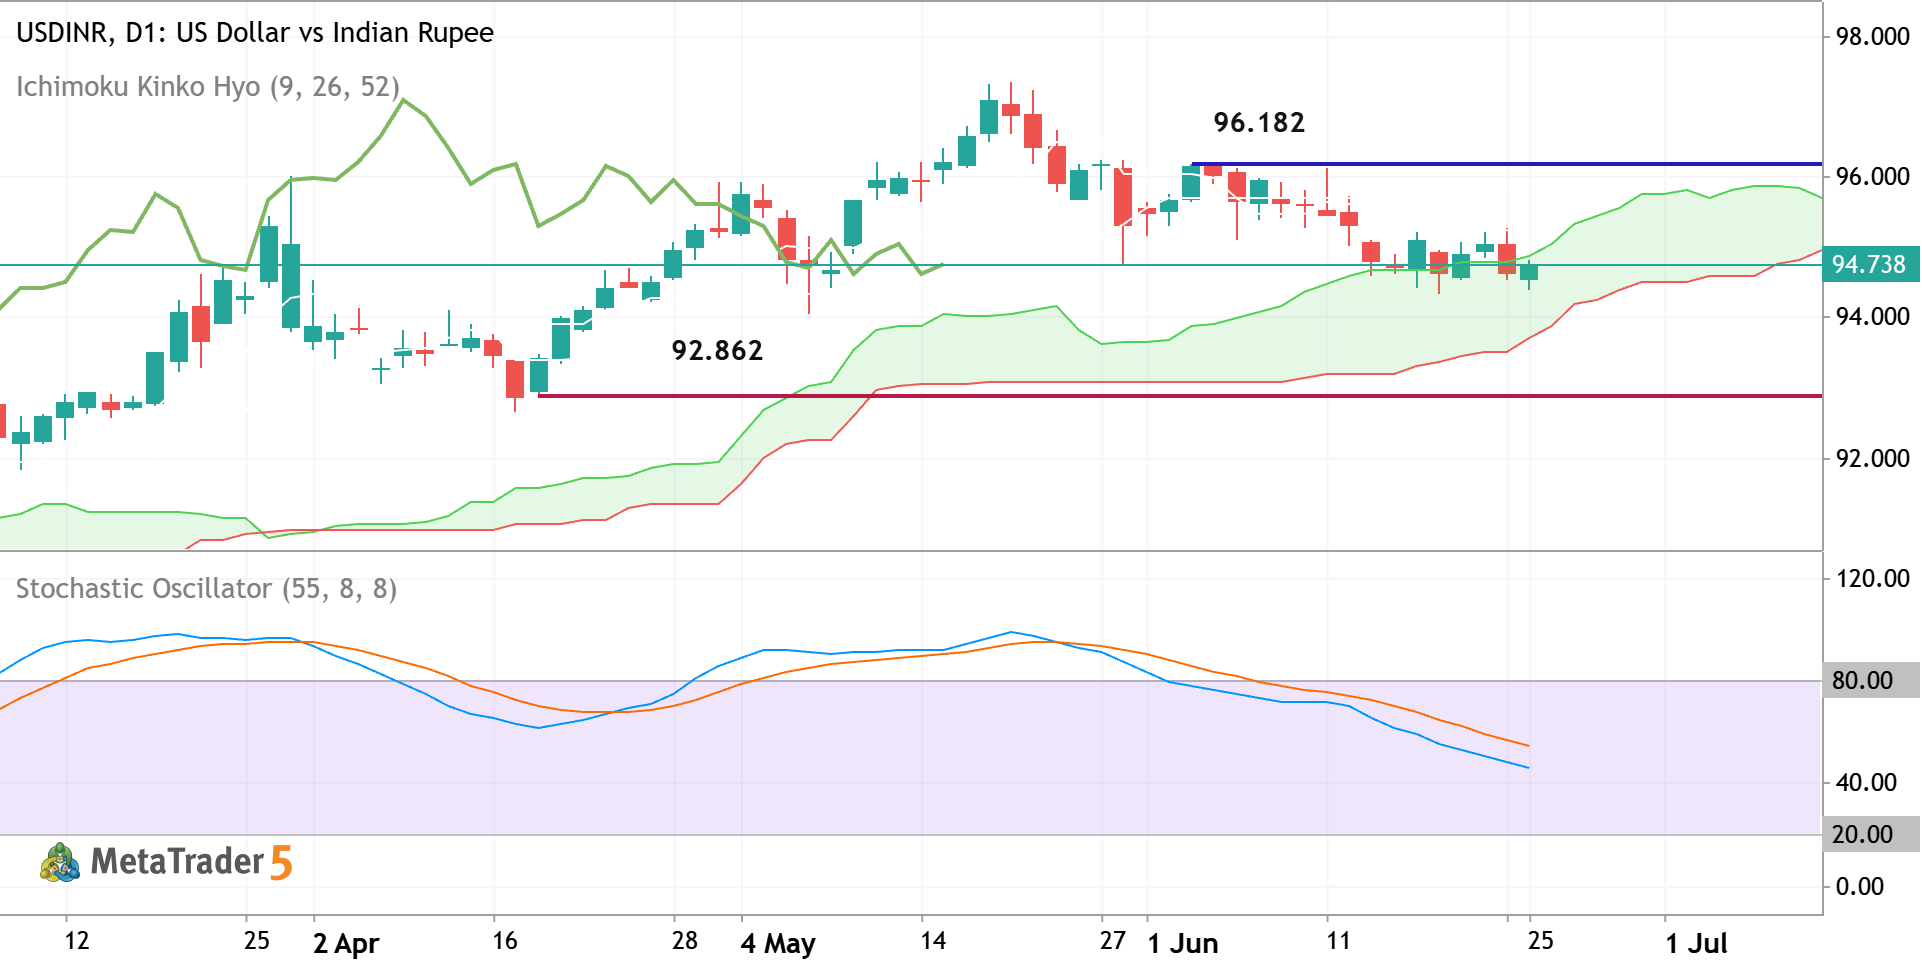
Daily price broke the upper border of Ichimoku cloud to below for the secondary ranging market condition. Chinkou Span line of Ichimoku indicator crossed the historycal price to below as well for the good daily breakdown to be started. Stochastic oscillator is showing the bearish condition to be continuing for example. If the price breaks support level at 92.862 to below so the primary bearish reversal will be started. If the price crosses the resistance level at 96.182 to above so the primary bullish trend will be resumed. Alternatively, the price will be on secondary ranging to be near and inside Ichimoku cloud waiting for direction. Recommendation : Waiting for Direction.
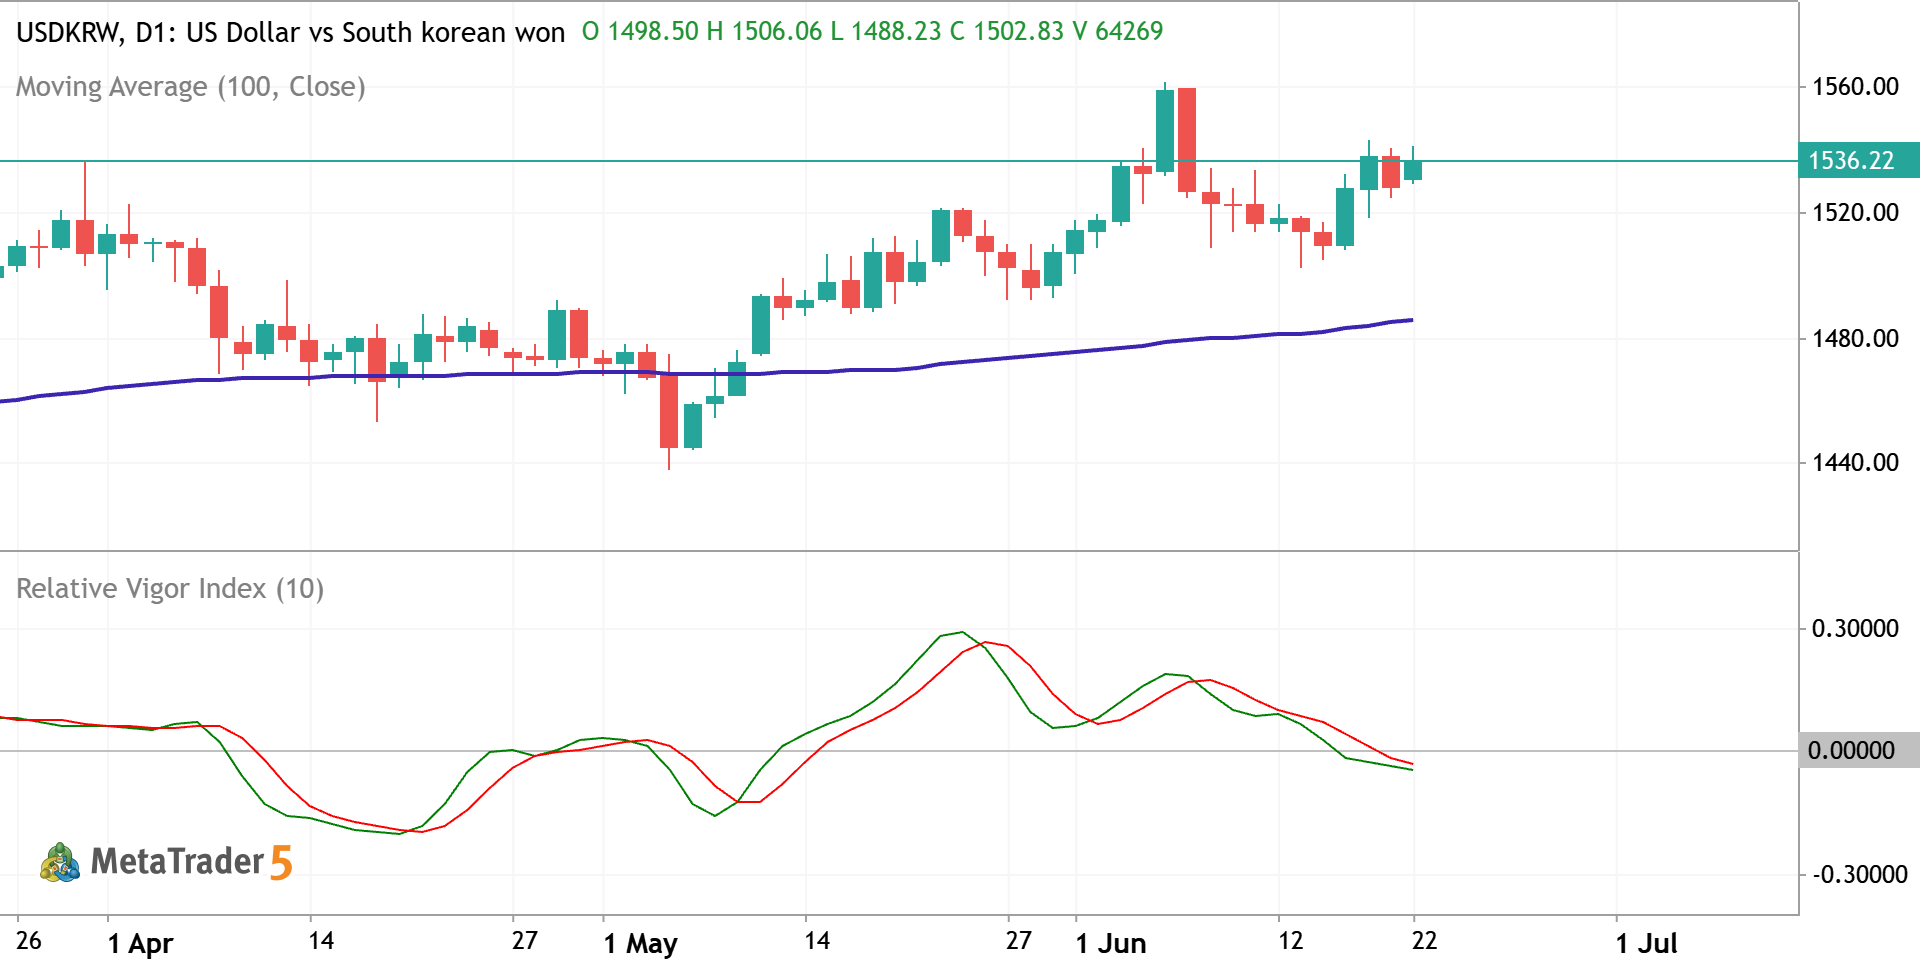
RVI - traditional general approach
Relative Vigor Index (RVI) measures the strength of a price trend by comparing a currency pair's closing price. It operates on the core logic that, in bullish markets, prices tend to close higher than they open, while in bearish markets, they close lower. RVI displays two lines: green line (which is the main RVI oscillator line) and red line (the signal line). Buy Signal: the green RVI line crosses above the red signal line. Sell Signal: the green RVI line crosses below the red signal line. Those crossover signals are more reliable in the direction of the main primary trend - primary bullish and primary bearish, for example - above/below or on the direction of 100 SMA.
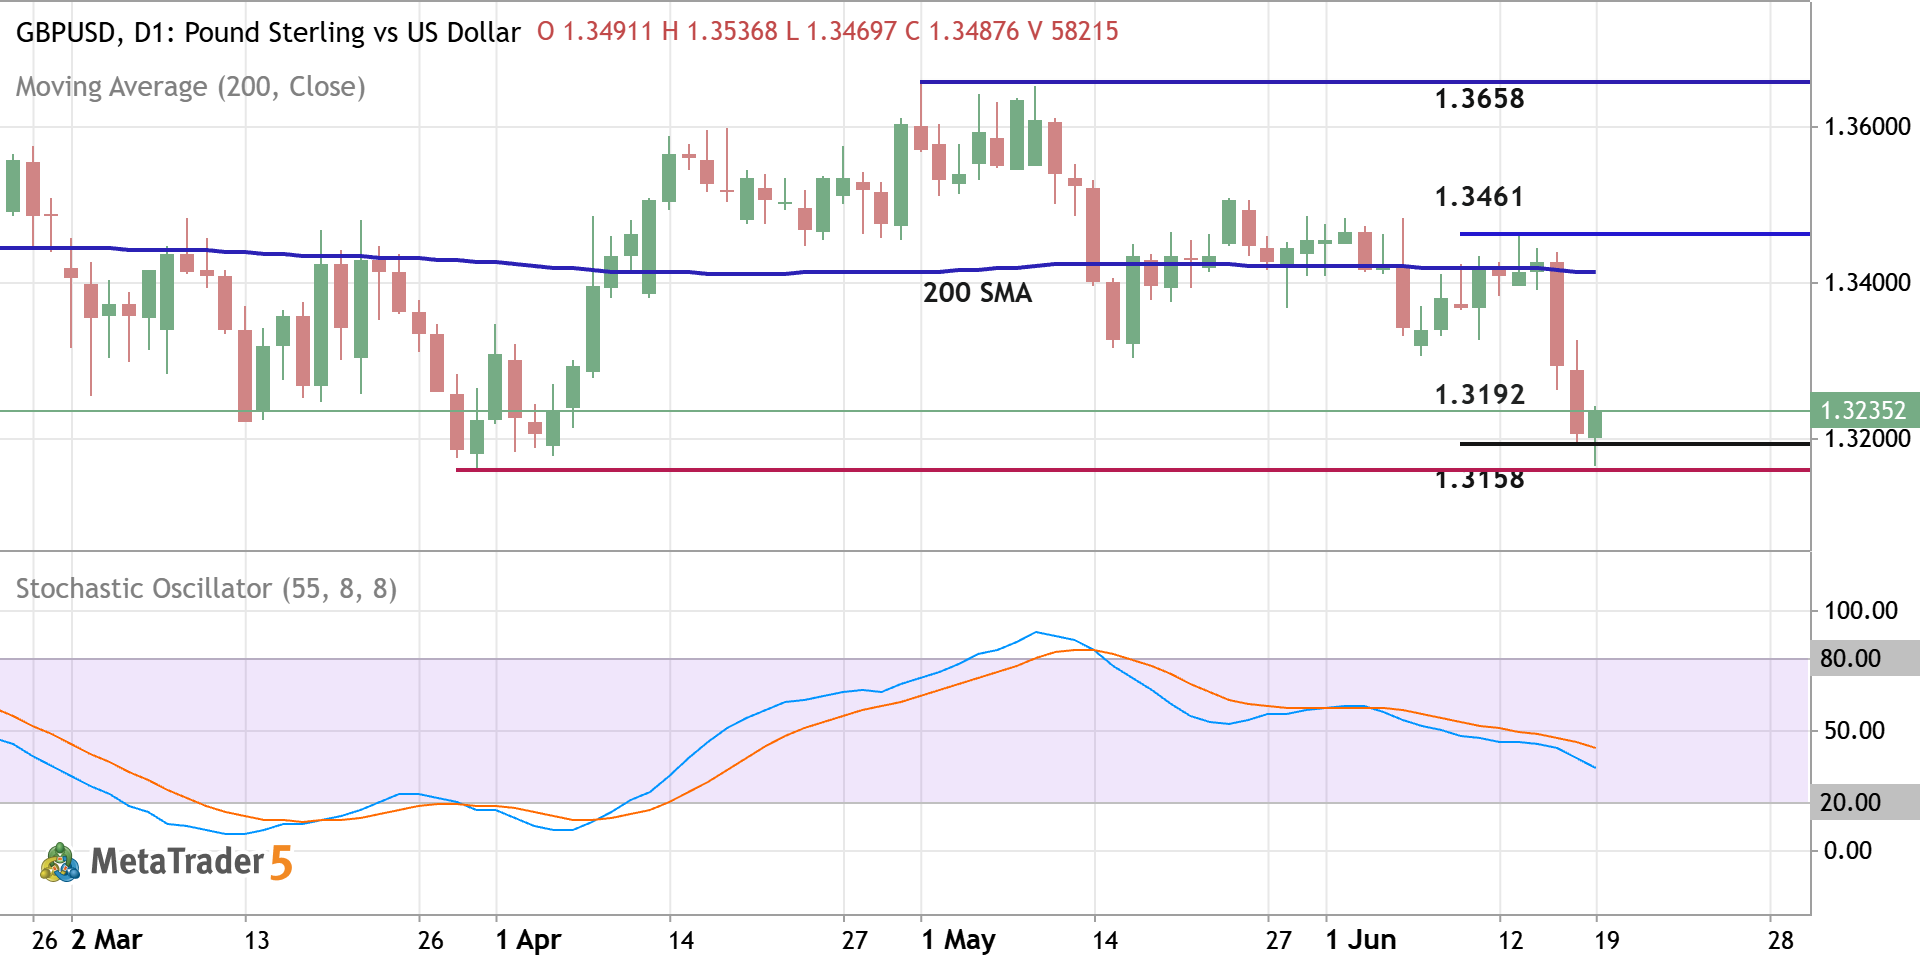
GBPUSD - Daily Trading Forecast
Daily price broke 200 SMA for the primary bearish reversal. The price is trying to cross the support level at 1.3192 for the bearish trend to be continuing. If the price breaks resistance level at 1.3461 together with 200 SMA to above so the primary bullish reversal will be started with 1.3658 possible target to re-enter. If the price crosses the support level at 1.3192 and support level at 1.3158 as well to below so the bearish trend will be continuing with 1.3009 possible global target. Alternatively, the price will be on secondary ranging within the primary bearish trend waiting for the direction of the bullish reversal to be started or the strong bearish trend to be continuing. Trading Summary : bearish breakdown; ready for the bear market rally to be started.
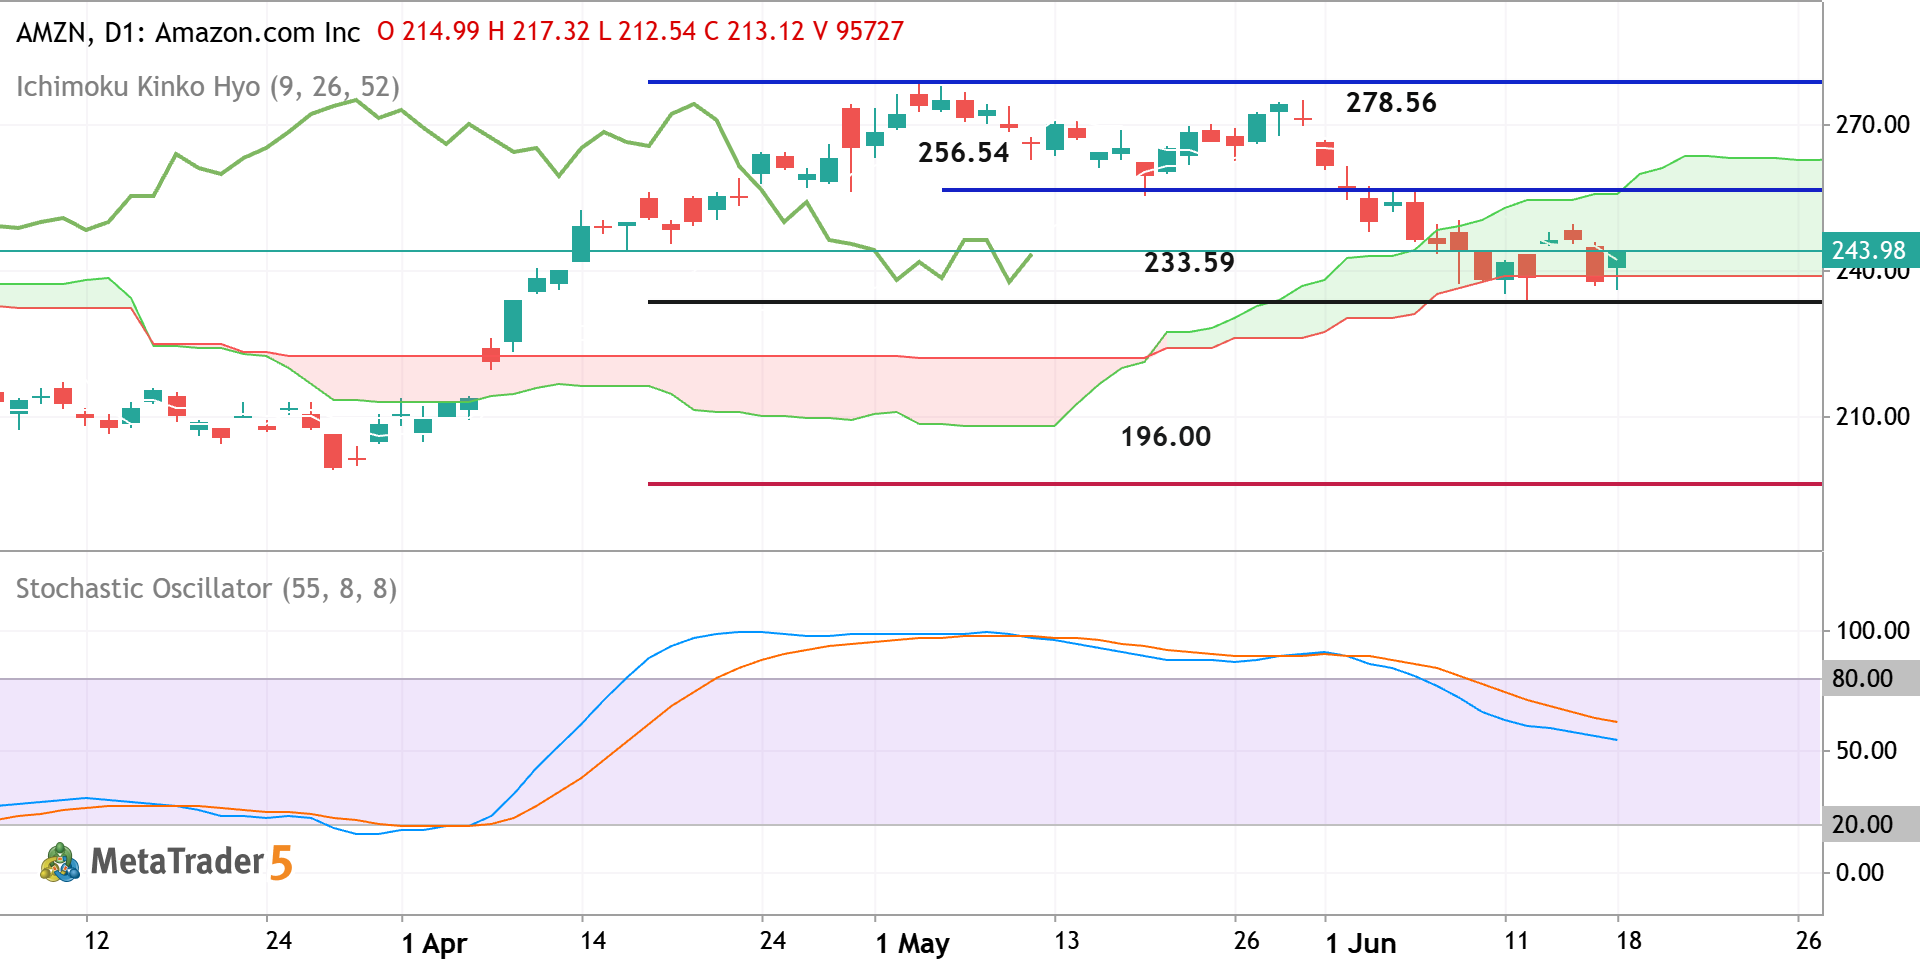

AMZN - Breakdown with the Possible Bearish Reversal
Daily price is located near and inside Ichimoku cloud for trying to break the support level at 233.59 to below for the primary bearish reversal to be started. Chinkou Span line of Ichimoku indicator broke the historical price to below for the strong breakdown to be started for the possible bearish reversal of the daily price movement. If the price crosses the 233.59 support ot below so we may see the primary bearish reversal with 196.00 as a possible target. If the price breaks the resistance at 256.54 to above so the primary bullish trend will be resumed with 278.56 target to re-enter, Alternatively, the price will be on secondary ranging to be inside and near the Ichimoku cloud waiting for direction. Trading Summary : breakdown with the possible bearish reversal
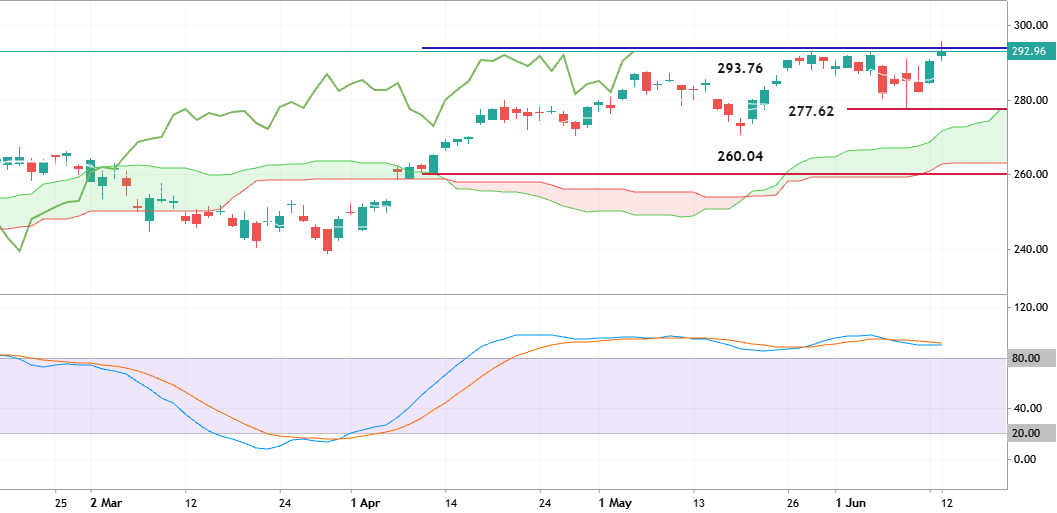

IWM - Daily Trading Forecast
The daily price is located above Ichimoku cloud in the bullish area of the chart. Stochastic oscillator is showing the overbought market condition but the price is still trying to break the resistance level at 293.76 for the goood breakout. If the price breaks the resistance at 293.76 to above on daily close bar so the strong bullish trend will be resumed. If the price crosses 277.62 support to below so the primary bearish reversal may be started with the secoindary ranging way and with 260.04 as a good terget to re-enter. Alternatively, the price will be on ranging within s/r channel waiting for the direction of the strong trend to be started. Trading Summary : ranging; ready for the daily breakout

TTE - Daily Trading Forecast
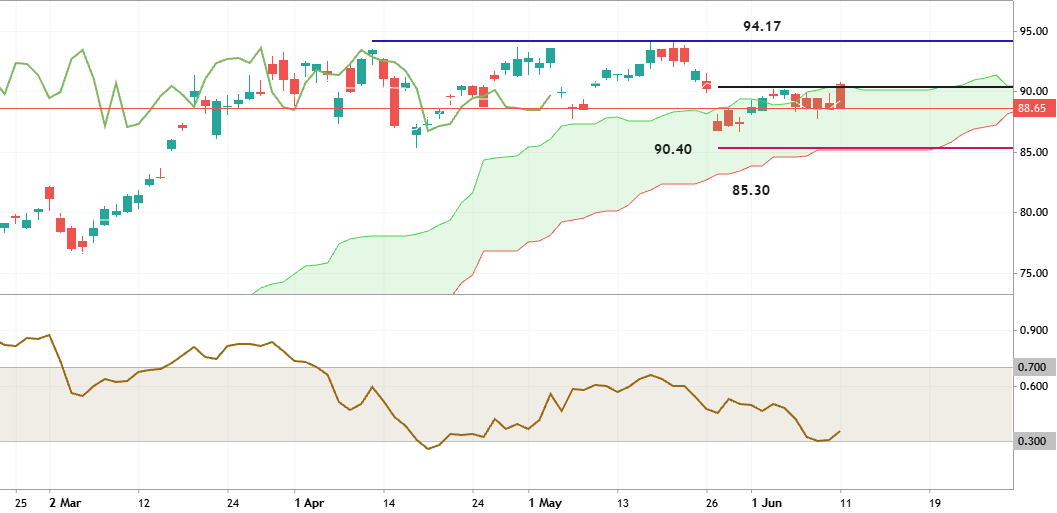
Daily price is located inside Ichimoku cloud for trying to cross the resistance level at 90.40 to above for the bullish trend to be resumed. If the price breaks resistance at 90.40 on the daily close bar so the bullish trend will be resumed with 94.17 resistance as the possible target. If the price crosses the support level at 85.30 so the daily bearish reversal will be started. Alternatively, the price will be on ranging waiting for direction. Trading Summary : ranging waiting for the bullish trend to be resumed.

HOOD - Long-Term Technical Forecast
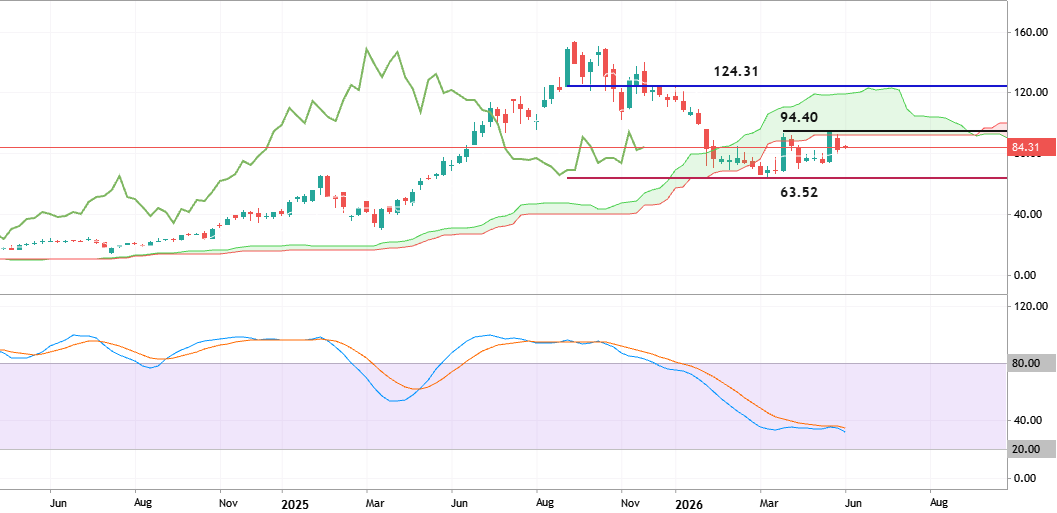
Weekly price is located near and below Ichimoku cloud in the bearish area of the chart. The symmentic pattern was formed with support level at 63.52 and resistance at 94.40. If the price breaks the support level at below on weekly close bar so the bearish trend will be resumed. If the price crosses the resistance level to above so the primary bullish reversal will be started with 124.31 resistance level as a final reversal target to re-enter. Alternatively, the price will be on secondary ranging to be inside s/r channel for direction. Trading Summary : ranging for direction - bearish trend to be resumed or the bullish reversal to be started.
XBRUSD - Daily Trading Forecast
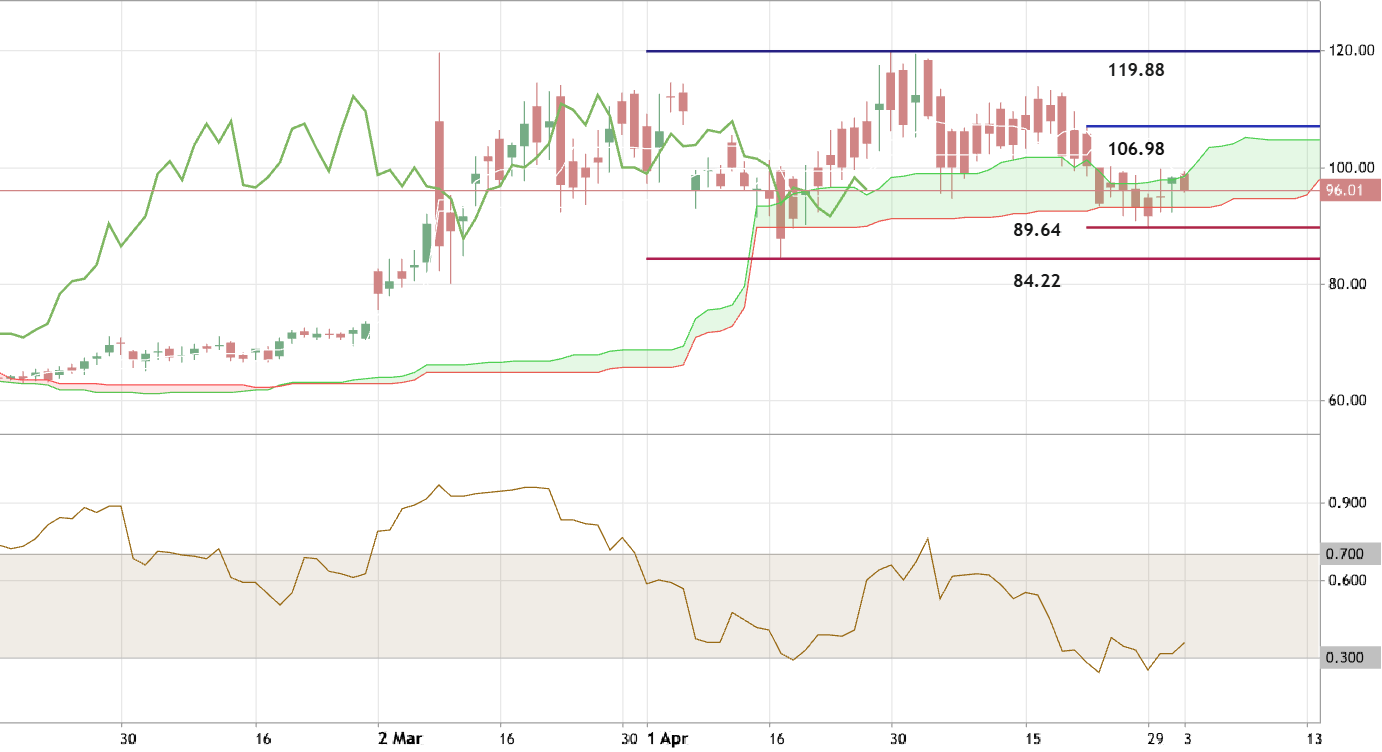
Daily price is on ranging to be inside Ichimoku cloud and in the s/r channel for direction: if the price breaks resistance level at 106.98 to above so the primary bullish trend will be resumed with 119.88 level as a possible target; if the price crosses support level at 89.64 to below so the primary bearish reversal will be started with 84.22 level to re-enter; alternatively, the price will be on secondary ranging waiting for direction. Trading Summary : ranging for direction
USDCHF - Daily Trading Forecast
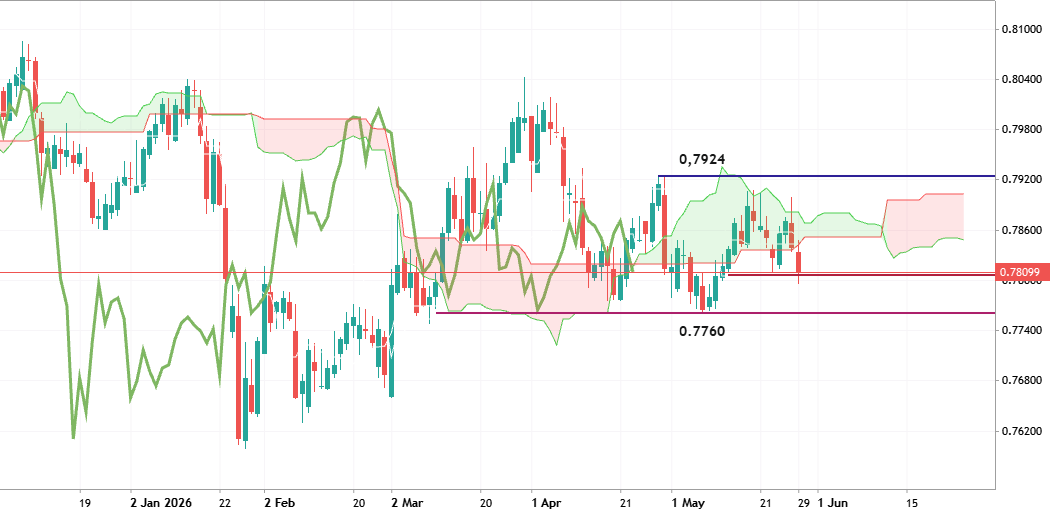
Chinkou Span line of Ichimoku indicator is breaking historical price to below together with the daily price which was broke Ichimoku cloud to below as well for the primary bearish reversal. If the price crosses support level at 0.7806 to below on the close daily bar with 0.7760 possible target to re-enter so the bearish trend will be continuing. If the price breaks 0.7924 resistance level to above so the primary bullish reversal will be resumed. Alternatively, the price will be on ranging within s/r channel for direction. Trading Summary : possible bearish trend to be continuing