

 Apri profilo MQL5
Grafici & Idee


Force Index - the Impulse Strategy
Many traders fail because they trap themselves in false moves. The price breaks a level, instantly reverses, and hits their stop loss.To avoid this, use the Force Index (13 periods). It uses volume to confirm if big players are backing the move. How to trade upward breakout : Find a strong resistance line. Wait for a candle to close above it. The Force Index must show a sharp upward spike. Action: Open a buy trade. How to trade downward breakdown : Find a strong support line. Wait for a candle to close below it. The Force Index must show a sharp downward spike. Action: Open a sell trade. Quick checklist : Breakout/Breakdown + Flat Force Index = False Move (Stay out). Breakout/Breakdown + Spiking Force Index = Real Impulse (Enter the trade).
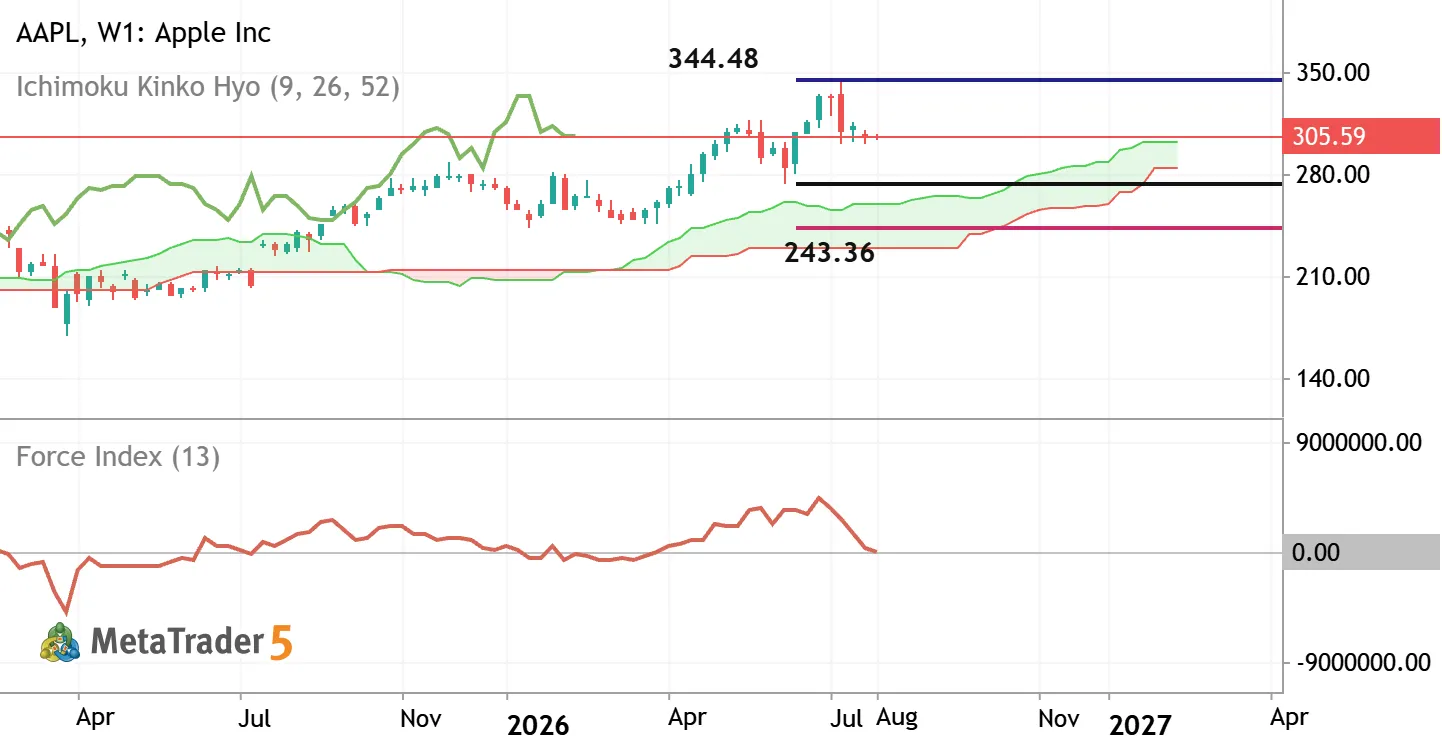

Force Index - traditional general approach
Force Index indicator was developed by Alexander Elder. It is a volume and momentum oscillator designed to measure the strength of buyers (bulls) during rallies and sellers (bears) during market declines. Force Index value above zero indicates dominant buying pressure. Negative value of Force Index (below zero) suggests strong selling pressure. Alternatively, if the price is on low volume so it is indicating the flat or the ranging market condition for the price to be moved within narrow support/resistance channel for example. The traders are traditionally using this indicator with two parameters: short-term approach (2 periods) - it is used to identify entry points during pullbacks; medium-term approach (13 periods) as a trend-following tool to indentify the primary trend as the bearish

XOM - Daily Trading Forecast
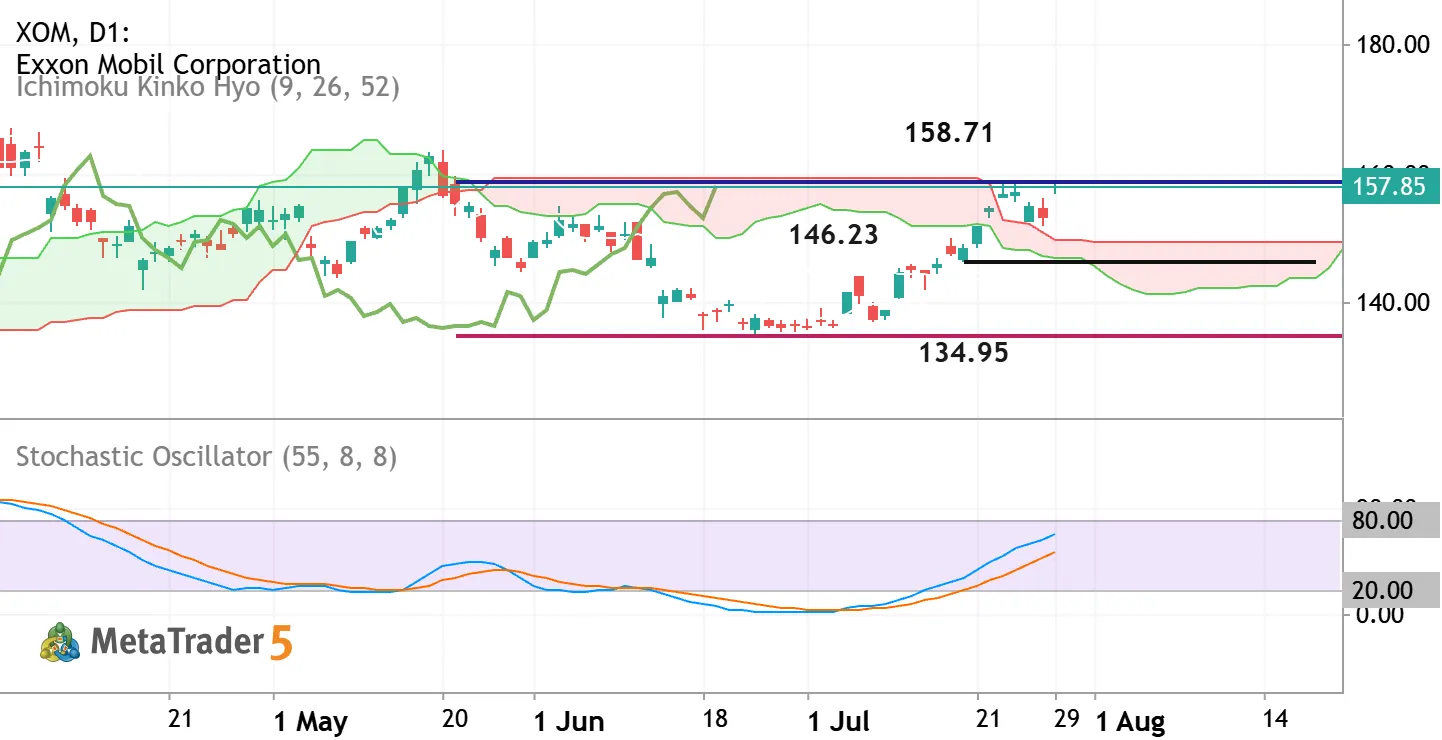
The daily price is located near and above Ichimoku cloud in the bullish area of the chart: Chinkou Span line of Ichimoku indicator already broke the historical price to above for the good breakout to be started, and the price crosses the Ichimoku cloud to above as well for the daily primary bullush reversal. If the price breaks resistance level at 158.71 so the strong bullish trend may be continuing. If the price crosses support level at 146.23 to 134.95 as the nearest possible target so primary bearish trend will be resumed. Alternatively, the price will be on secondary ranging to be near and inside Ichimoku cloud and within s/r channel waiting for direction of the strong trend to be started. Trading Summary : breakout with the possible daily bullish reversal
Simple Trading Setup with Two Simple Moving Averages
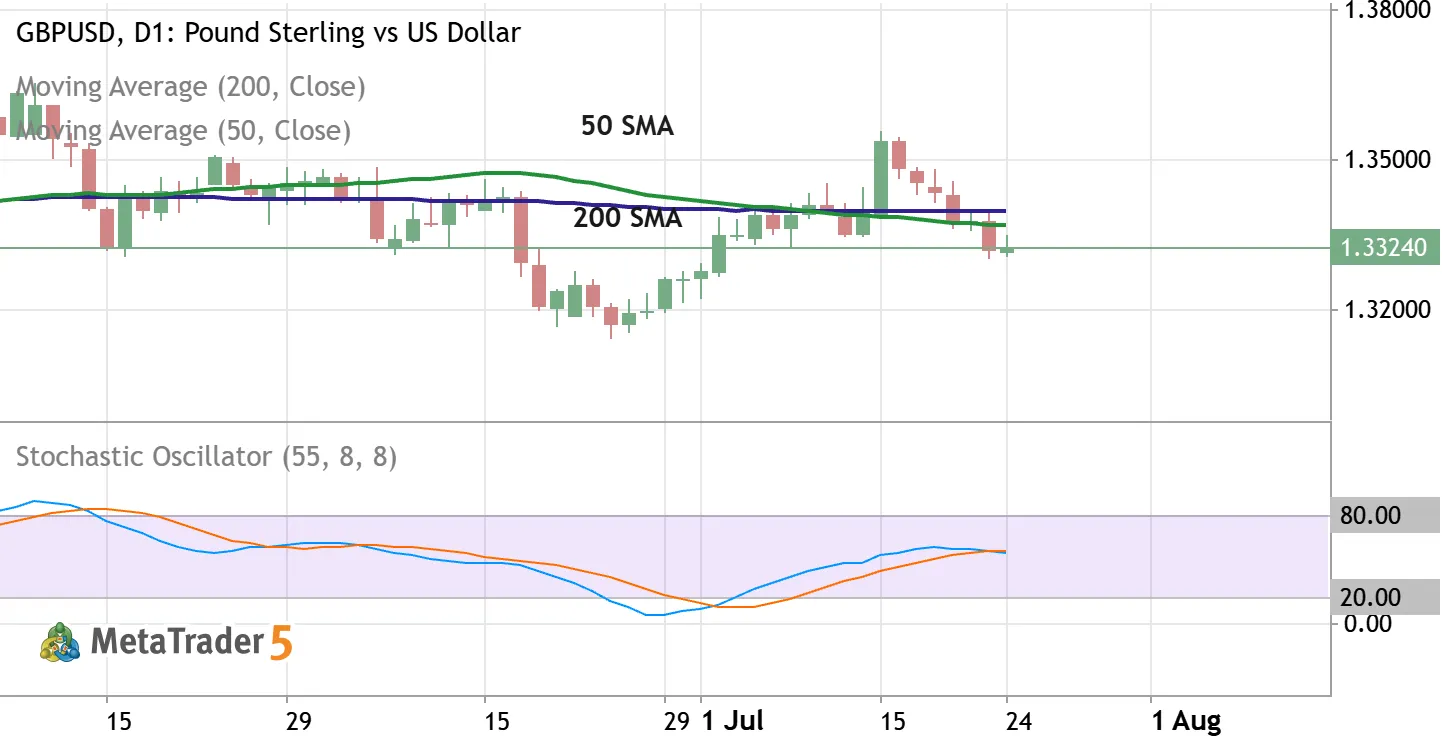
A simple and reliable educational setup. When the 50 SMA crosses above the 200 SMA from below, it signals a potential bullish move. When it crosses below from above, a bearish move may follow. Signals are rare but long-term. Adding Stochastic (55,8,8) helps confirm the momentum - look for it turning above 20 for longs or below 80 for shorts. This is an example about how two moving averages can define the trend.
XTIUSD - Daily Trading Forecast
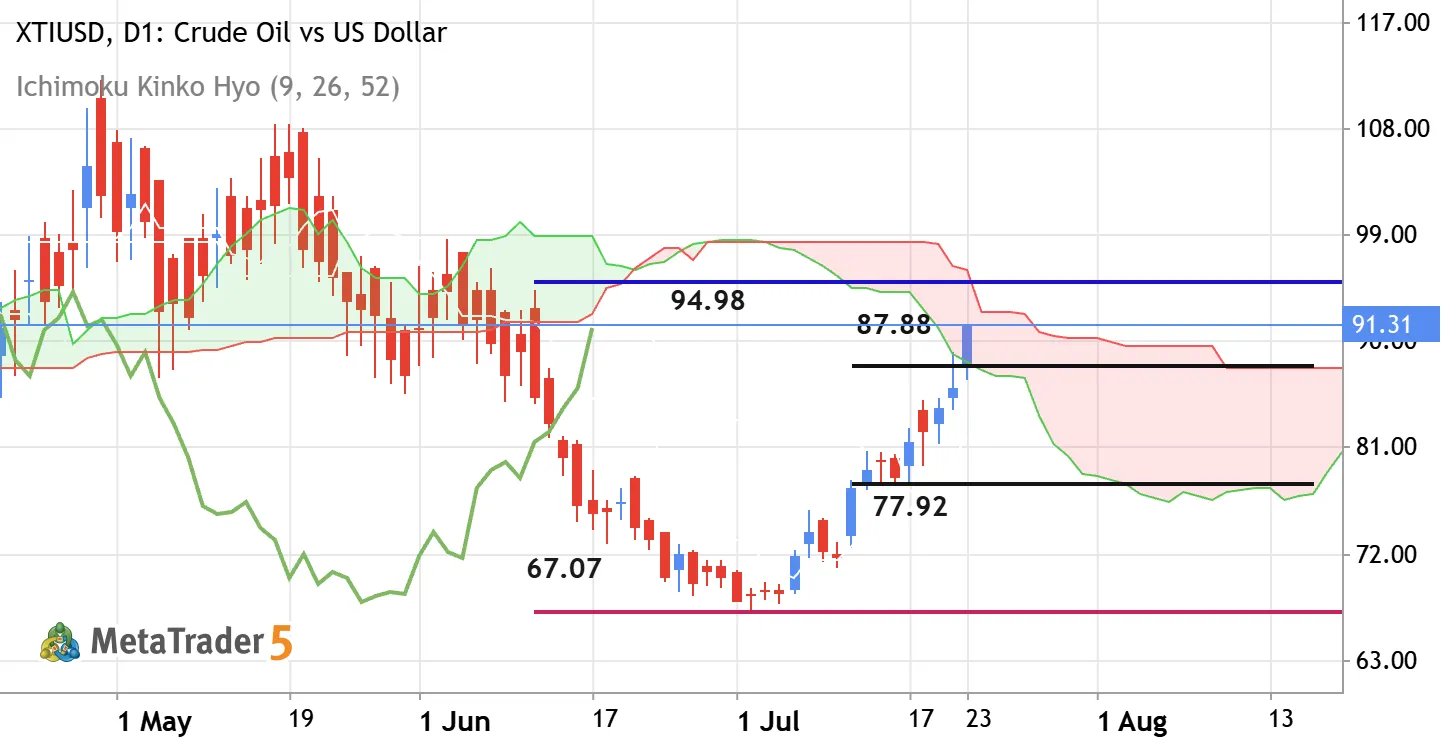
Daily price is breaking Ichimoku cloud together with the level at 87.88 to above for the primary bullish reversal. Stochastic oscillator is showing the uptrend in the near future, and Chinkou Span indicator broke the historical price for the good breakout to started. If the price breaks the level at 87.88 to above so the daily bullish reversal will be started with 94.98 level to re-enter. If the price crosses support level at 77.92 to below so the daily bearish trend will be resumed with 67.07 possible target for example. Alternatively, the price will be ranging near within s/r channel waiting for the direction of the strong trend to be started. Trading Summary : daily breakout with the possible daily bullish reversal
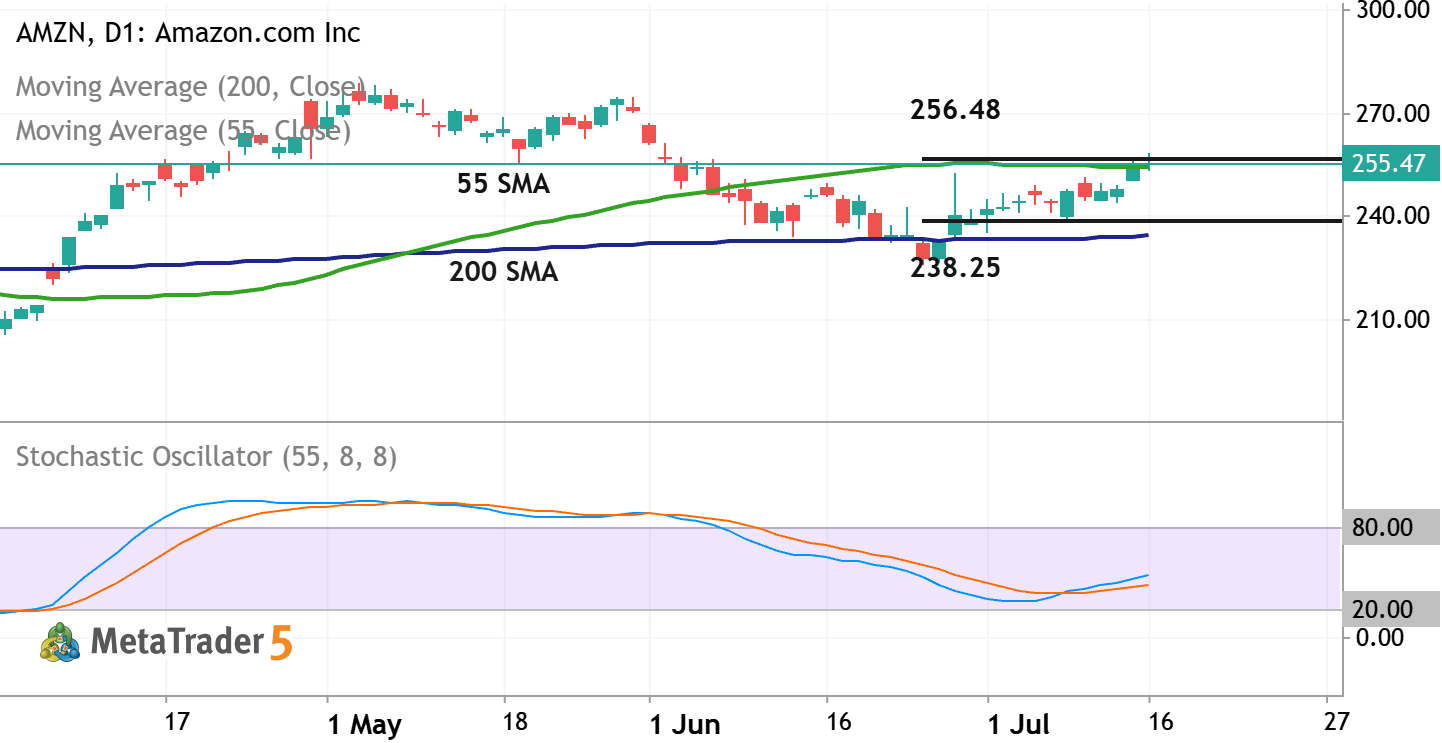

AMZN - Daily Trading Forecast
Daily price is located above 200 SMA in the bullish area of the chart. The Stochastic oscillator is showing the uptrend to be started by crossing the 50 level to above, and the price is trying to break the resistance level at 256.48 together with 55 SMA to above for the strong bullish trend to be continuing. If the price breaks resistance at 256.48 together with 55 SMA to above so the primary bullish market condition will be continuing for daily price. If the price crosses support level at 238.25 together with 200 SMA to below so the primary bearish reversal will be started. Alternatively, the price will be on secondary ranging above 200 SMA to be inside s/r levels waiting for direction of the strong trend tioo be started. Trading Summary : bullish ranging for direction.
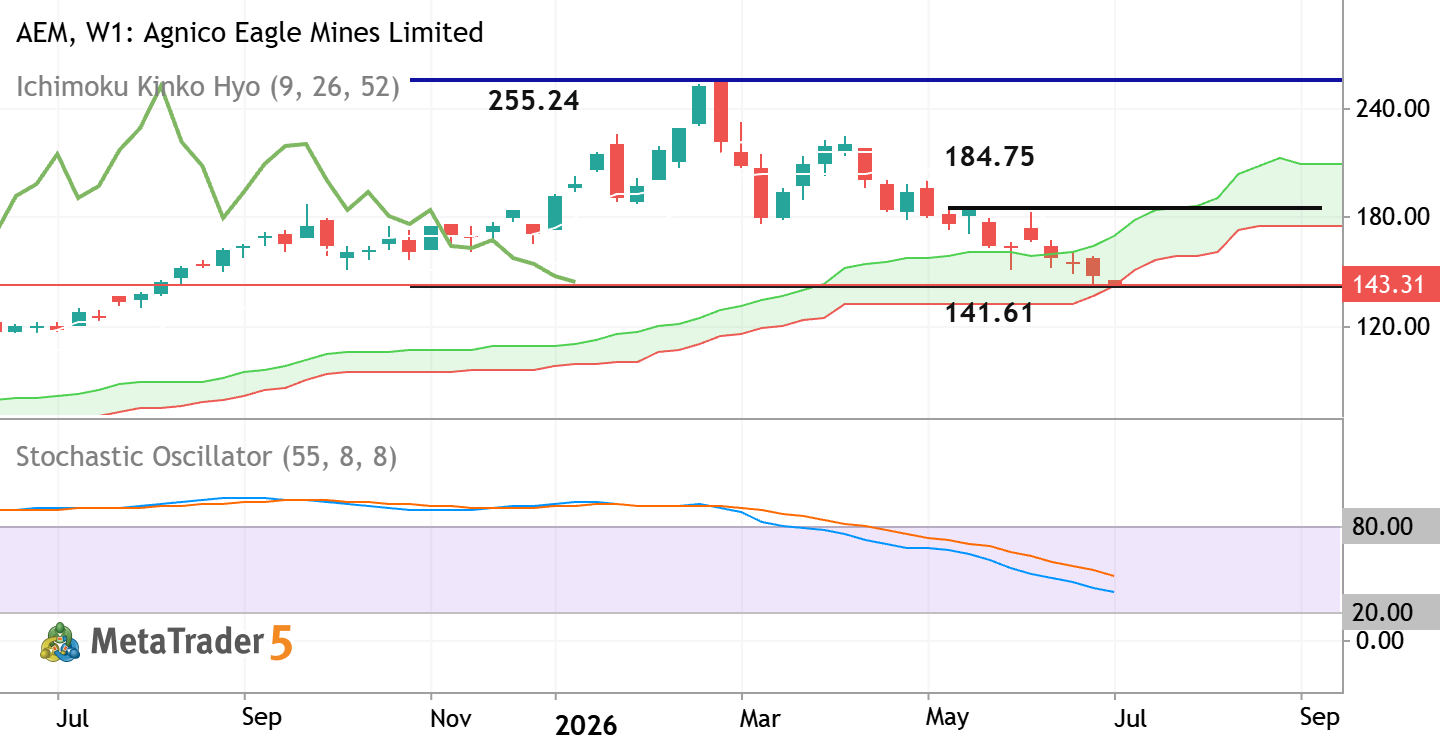

AEM - Long-Term Technical Forecast
Weekly price is breaking the Ichimoku cloud to below for the possible weekly bearish reversal. Chinkou Spam line of Ichimoku indicator crossed the historical price for the strong breakdown to be started, and Stochastic oscillator is showing the downtrend in the near future as well for example. If the price breaks support level at 141.61 to below so the primary weekly bearish reversal will be started. If the price crosses resistance at 184.75 to above together with 255.24 as a good terget to re-enter so the weekly bullish trend will be resumed. Alternatively, the price will be on secondary ranging within s/r channel to be near and inside Ichimoku cloud waiting for the direction of the strong trend to be started. Trading Summary : possible breakdown with the primary weekly bearish reversal
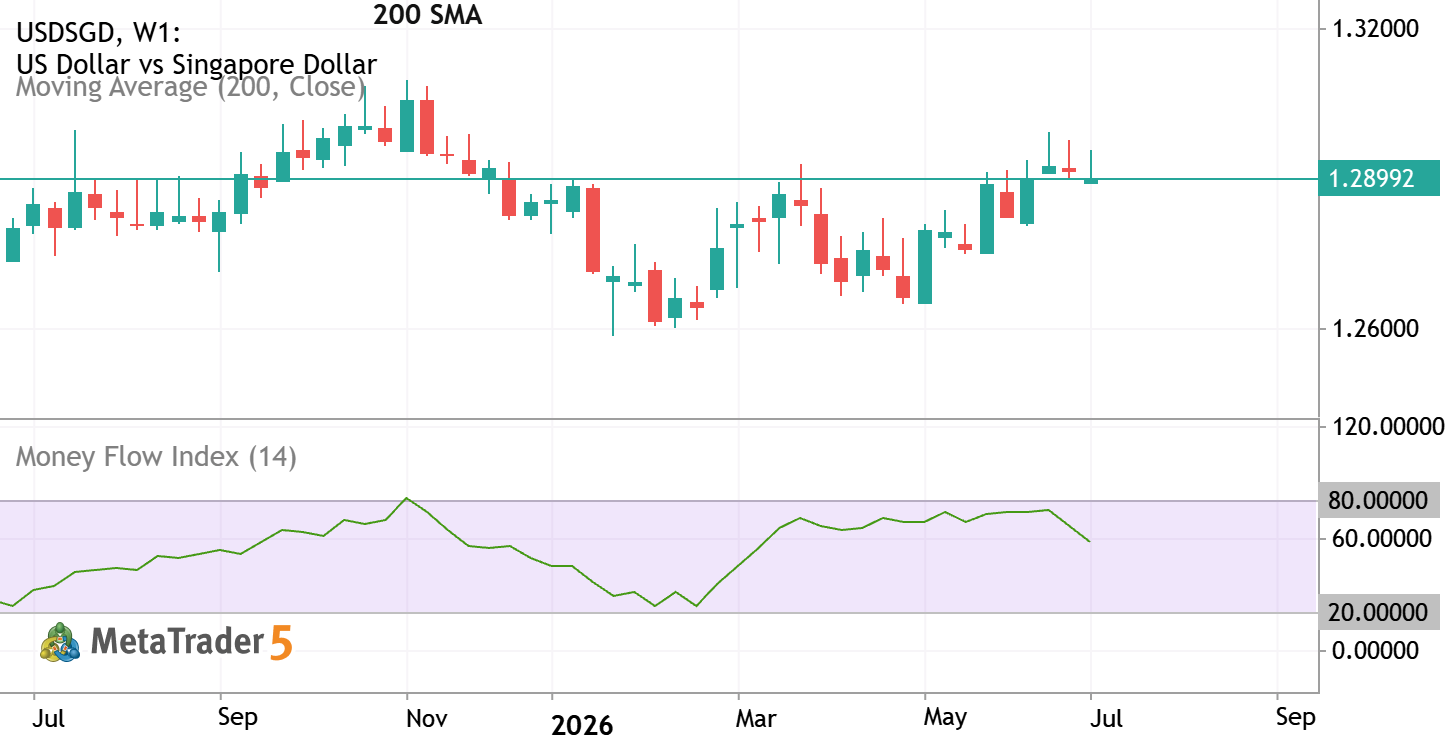
Money Flow Index - traditional general approach
Money Flow Index (MFI) is a momentum indicator that measures the rate at which money is invested into or withdrawn from a security. Traditional general approach to use MFI is the using it as the Trend Filter:
MFI (14) + Simple Moving Average (SMA with period 200) on the price chart. Buy Rule (Long) : price is above the SMA. Wait for the MFI to drop below 20 (oversold) and start rising. Sell Rule (Short) : price is below the SMA. Wait for the MFI to rise above 80 (overbought) and start falling. Traders often monitor these zones for potential price peaks or bottoms.
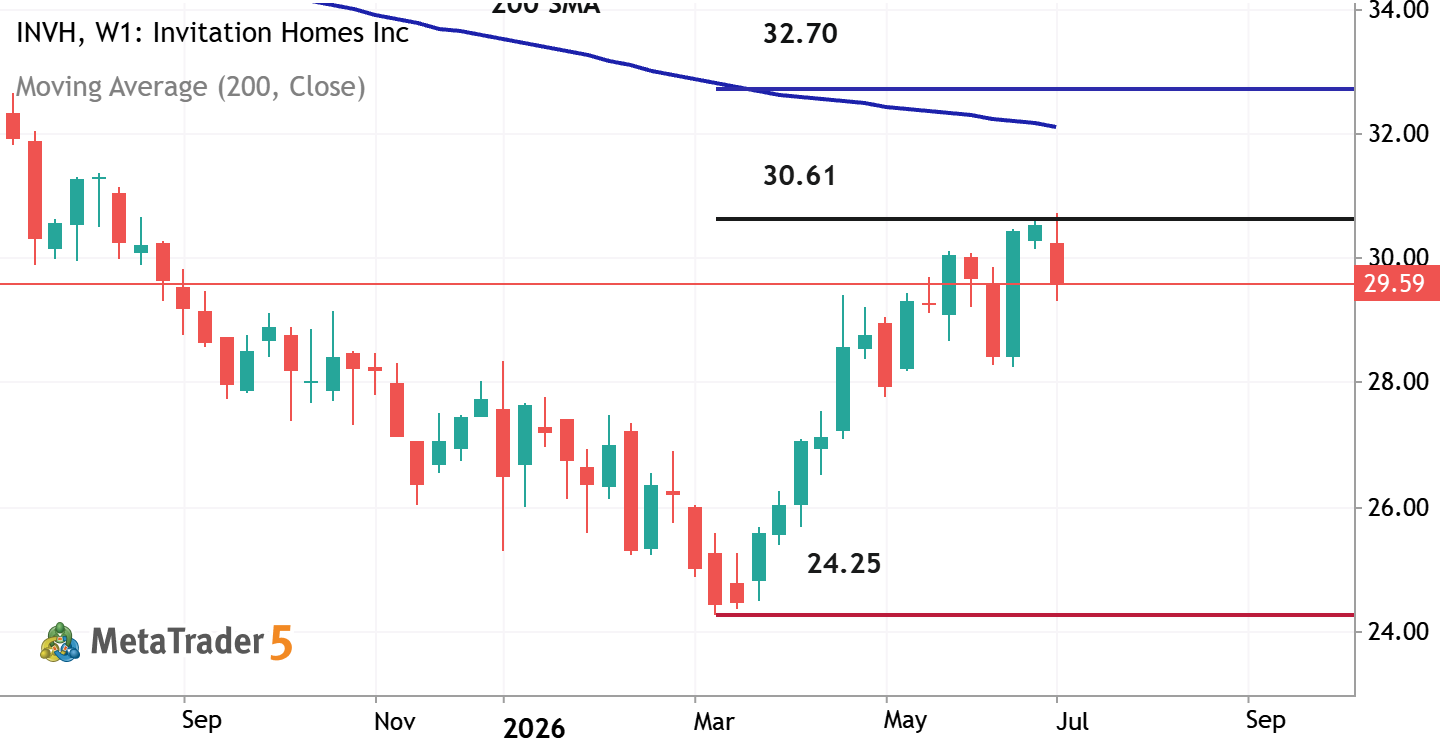

INVH - Long-Term Forecast
Weekly price is located below 200 SMA in the bearish area of the chart. The price was on bear market rally but it was bounced from resistance level at 30.61 to below for the bearish trend to be resumed. If the price breaks 30.61 resistance together with 200 SMA to above so the weekly bullish reversal will be started with 32.70 level as the possible target to re-enter. If the price crosses support level at 24.25 to below so the strong bearish trend will be continuing. Alternatively, the price will be on secondary ranging within the primary bearish trend to be within 24.25/30.61 s/r channel waiting for direction. Trading Summary : ranging to be near and below 200 waiting for direction
USDKRW - Daily Trading Forecast
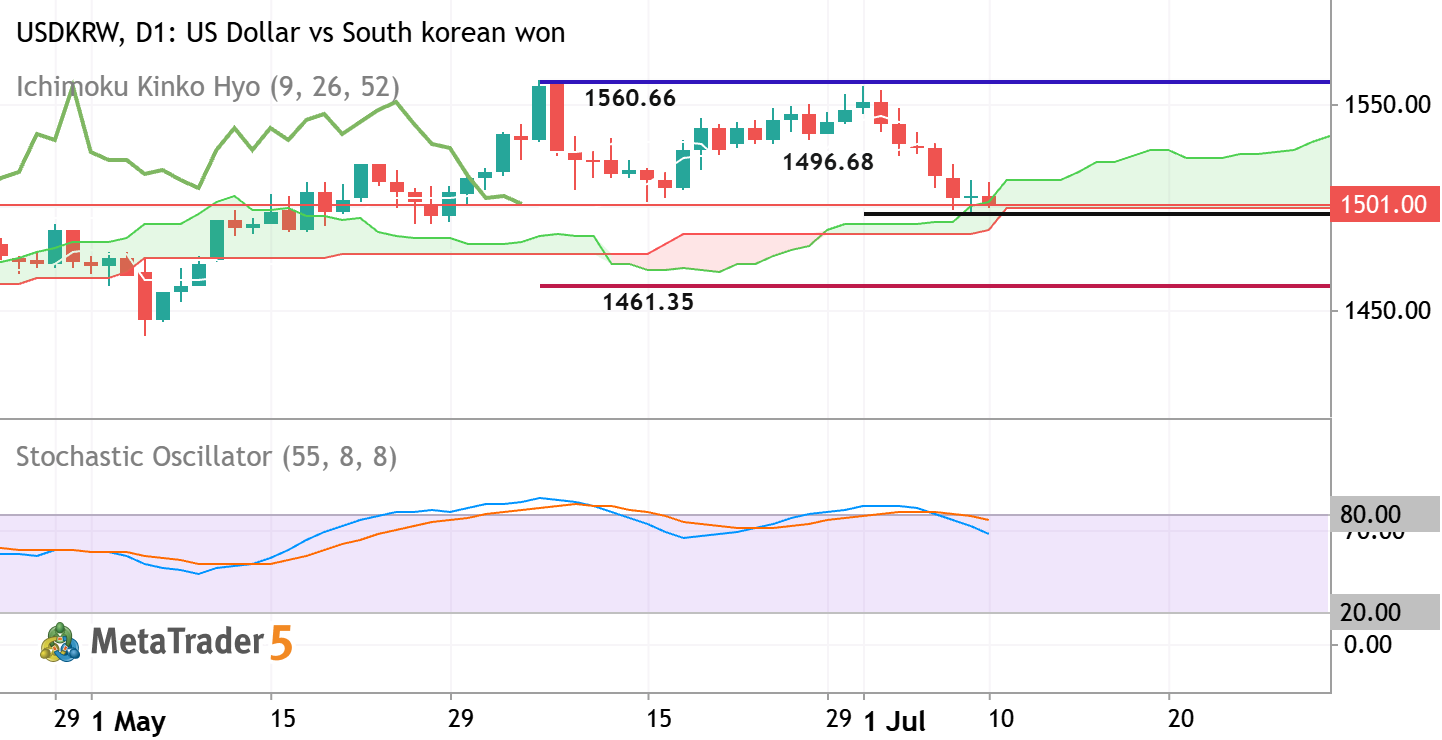
Daily price was bounced from resistance level at 1560.66 to below for the secondary correction to the bearish reversal to be started. Chinkou span line of Ichimoku indicator is crossing the historical price to below for the good breakdown to be started, and Stochastic oscillator is showing the overbought level for the price. Thus, finally, the price is testing 1496.68 support level to below for the primary daily bearish reversal. If the price breaks resistance level at 1560.66 to above on the daily close bar so the primary bullish trend will be resumed. If the price crosses 1496.68 support level to below so the daily bearish reversal will be started with 1461.35 as the possible target. Alternatively, the price will be on ranging to be near and inside Ichimoku cloud waiting for direction

MRNA - Long-Term Technical Forecast
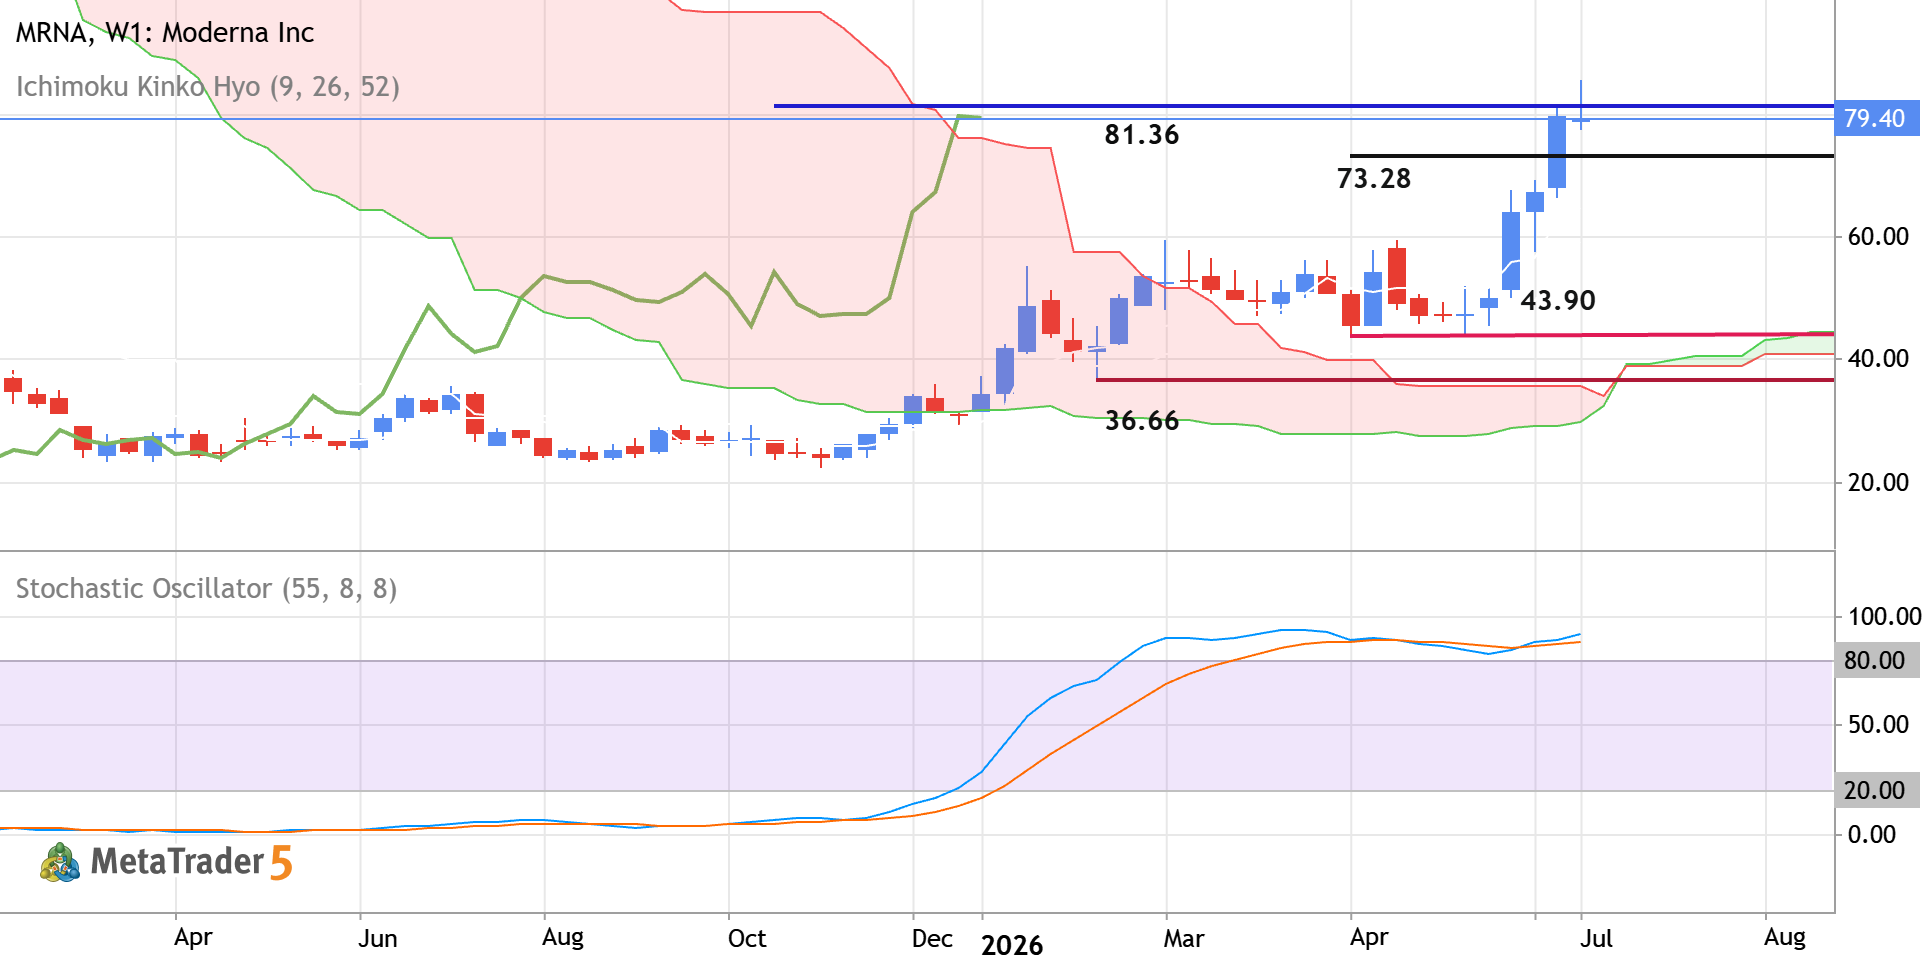
Weekly price is located above Ichimoku cloud in the bullish area of the chart for trying to cross the level at 81.36 to above for the strong bullish trend to be continuing. The price is on strong bullish breakout which is confirmed by Stochastic oscillator and Chinkou Span line. If the price breaks the 81.36 level to above on weekly close bar so the strong bullish trend will be continuing. If the price crosses the level at 73.28 to below so the secondary correction will be started. If the price breaks the support level at 43.90 to 36.66 to be crossed on weekly close bar so we may see the primary bearish reversal to be started on this W1 timeframe for example. Alternatively, the price will be on ranging to be near and above Ichimoku cloud waiting for direction. Trading Summary : bullish
Avesome Oscillator - traditional general approach
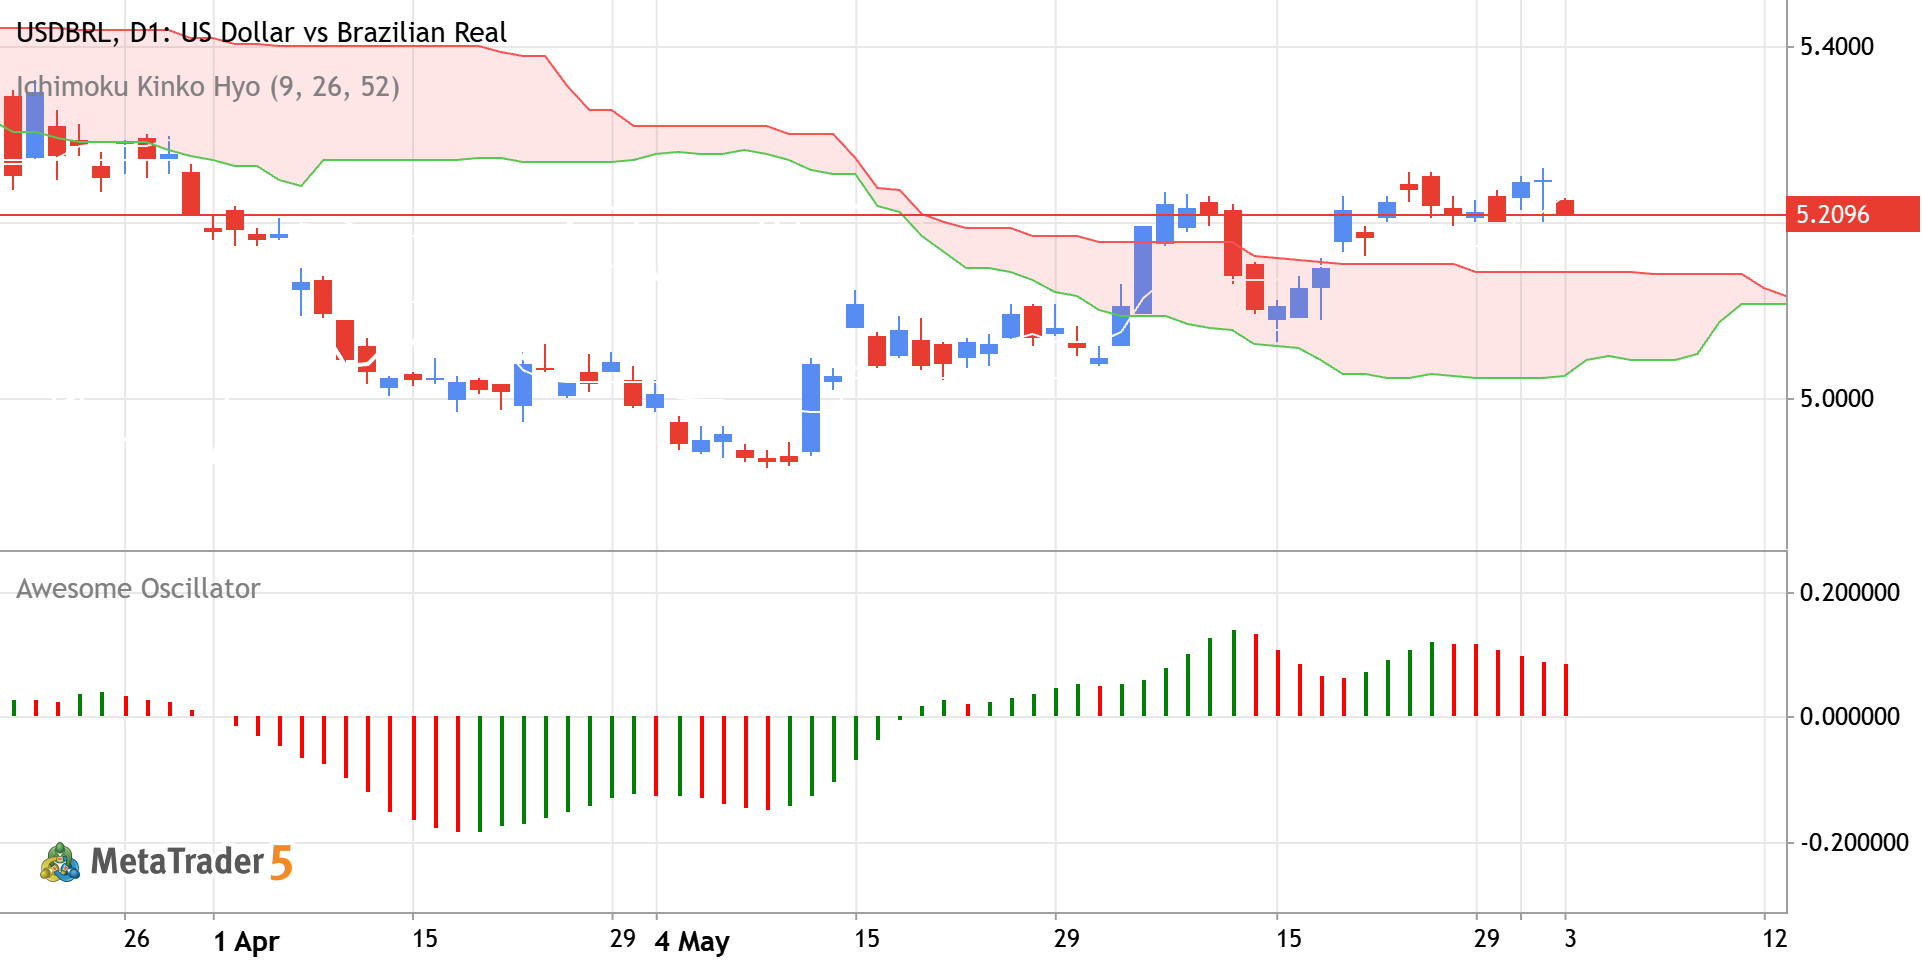
Awesome Oscillator (AO) is a momentum indicator that reflects market trend changes by comparing recent market velocity with historical velocity. The traditional trading approach focuses on capturing macro-driven trends and avoiding false breakouts caused by the pair's typical high volatility. Zero-Line Crossover This is the simplest trend-following signal indicating a shift in market direction. Bullish Signal (Buy): AO crosses from below zero to above zero. Bearish Signal (Sell): AO crosses from above zero to below zero. Apply Filter It can be 200-SMA or Ichimoku cloud for example. Only look for Buy signals if the price is above the 200-SMA or Ichimoku cloud. Only look for Sell signals if the price is below the 200-SMA or Ichimoku cloud. Best used on daily (D1) charts to capture large