
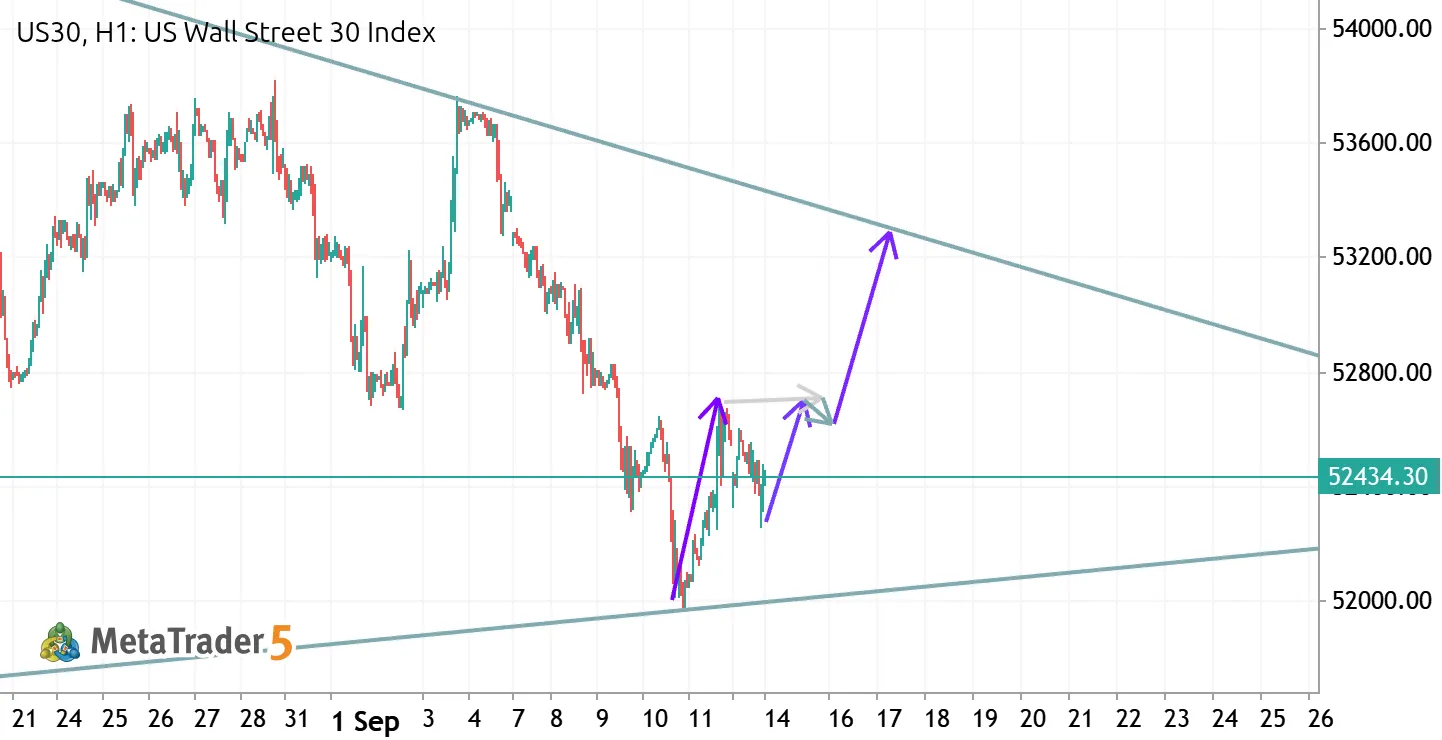
US30 has spent six weeks compressing between the descending resistance off the 5 August high and the rising support that's been in place since late July. Price is now deep into that contraction, and the way the last leg down resolved is what makes this interesting.
Instead of breaking the rising trendline, the market carved out a small inverse head and shoulders right on top of it: left shoulder around 52,150, the head at 51,950 where support was tested and rejected on 10 September, and a higher right shoulder near 52,300. That's a textbook sequence of a seller exhaustion — each attempt lower found buyers earlier than the last.
The neckline sits around 52,750. A clean H1 close above it opens the measured move toward 53,500, which lines up neatly with the descending trendline in the 53,300–53,400 zone by mid-week. That confluence is my first target.
Invalidation is simple: an hourly close back below 51,950 kills the pattern and the triangle support with it.

 MQL5-Profil
Neuer Kommentar
P.S. the pattern sits inside an unbroken triangle, so the descending resistance is a real ceiling.
The left shoulder is quite shallow relative to the head as well.