Force Index - the Impulse Strategy NVDA NVIDIA Corporation - Common Stock

Force Index - the Impulse Strategy

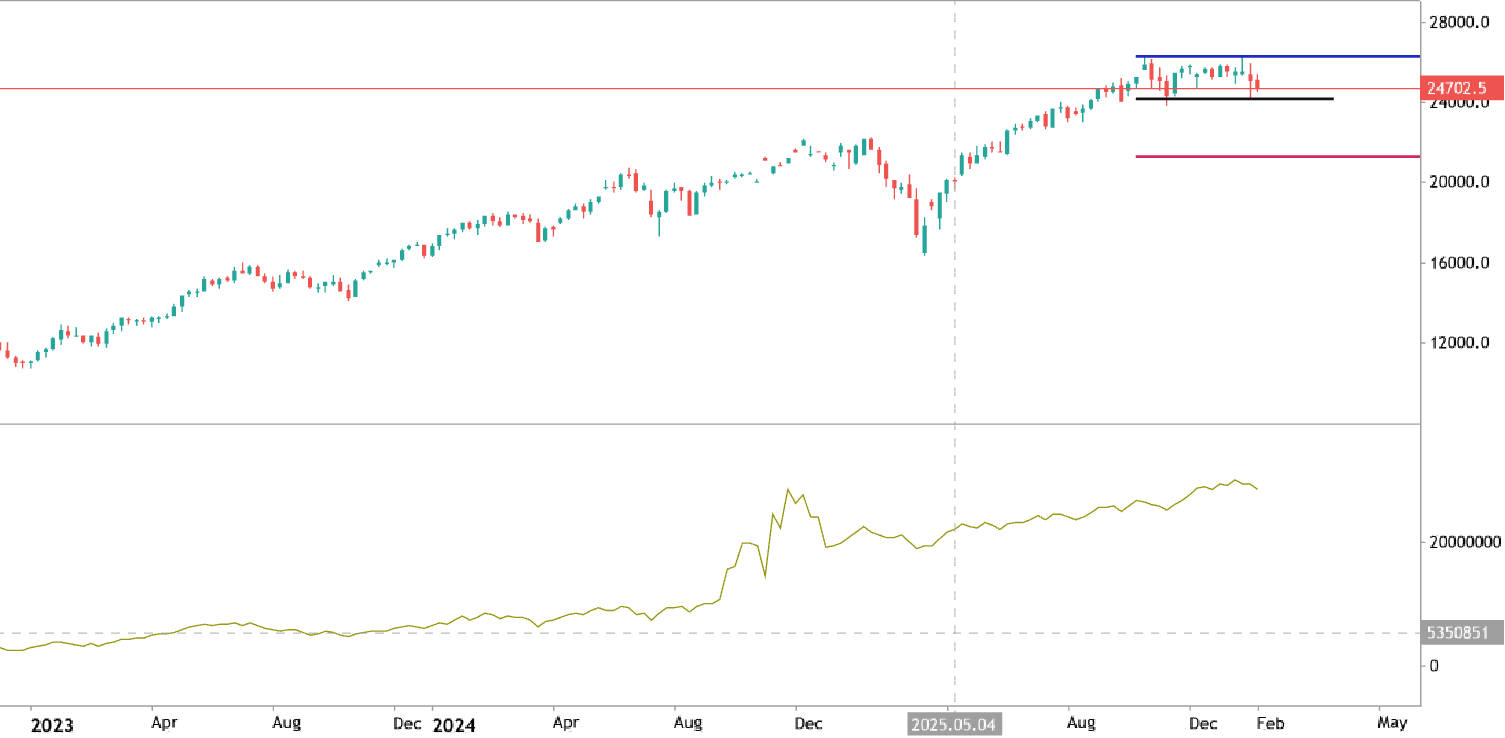
Many traders fail because they trap themselves in false moves. The price breaks a level, instantly reverses, and hits their stop loss.To avoid this, use the Force Index (13 periods). It uses volume to confirm if big players are backing the move. How to trade upward breakout : Find a strong resistance line. Wait for a candle to close above it. The Force Index must show a sharp upward spike. Action: Open a buy trade. How to trade downward breakdown : Find a strong support line. Wait for a candle to close below it. The Force Index must show a sharp downward spike. Action: Open a sell trade. Quick checklist : Breakout/Breakdown + Flat Force Index = False Move (Stay out). Breakout/Breakdown + Spiking Force Index = Real Impulse (Enter the trade).
Force Index - traditional general approach AAPL Apple Inc. - Common Stock

Force Index - traditional general approach

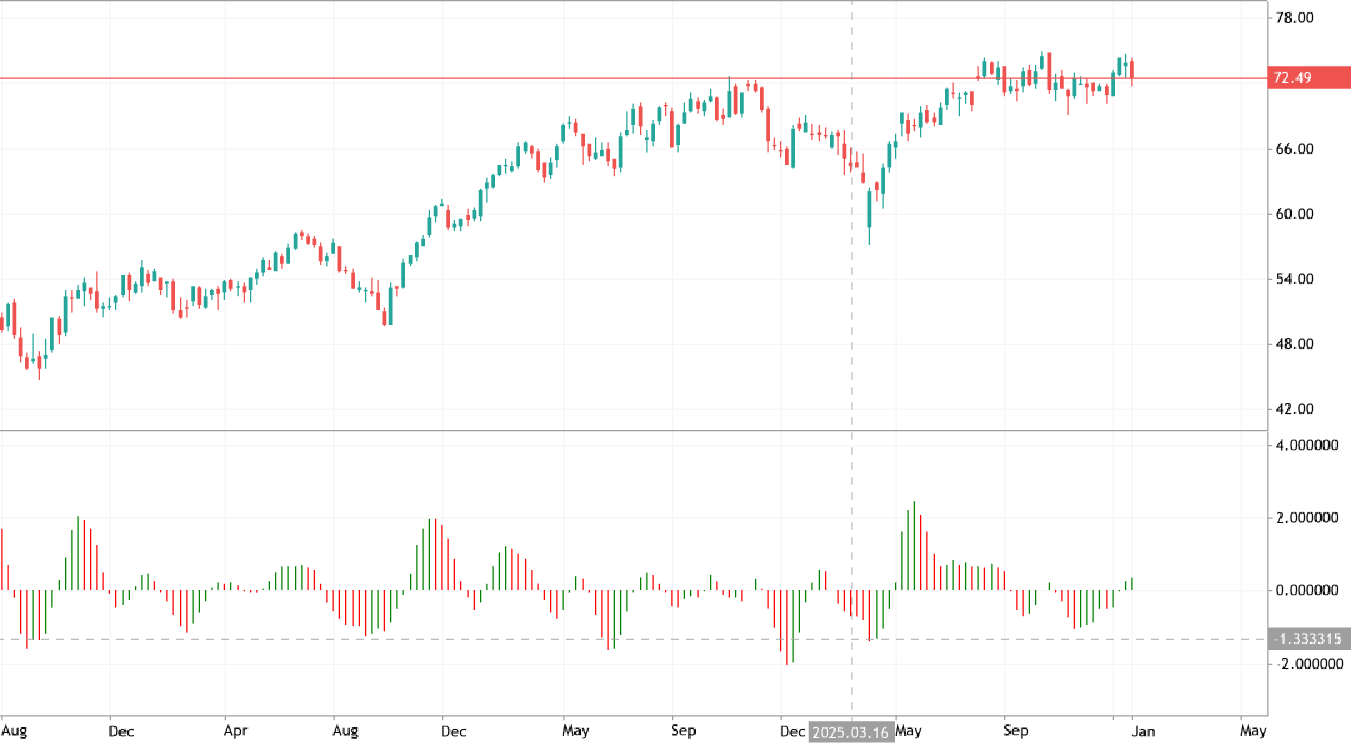
Force Index indicator was developed by Alexander Elder. It is a volume and momentum oscillator designed to measure the strength of buyers (bulls) during rallies and sellers (bears) during market declines. Force Index value above zero indicates dominant buying pressure. Negative value of Force Index (below zero) suggests strong selling pressure. Alternatively, if the price is on low volume so it is indicating the flat or the ranging market condition for the price to be moved within narrow support/resistance channel for example. The traders are traditionally using this indicator with two parameters: short-term approach (2 periods) - it is used to identify entry points during pullbacks; medium-term approach (13 periods) as a trend-following tool to indentify the primary trend as the bearish
GOLD (XAU/USD) MACRO RALLY & HEAVY RESISTANCE REJECTION SETUP XAUUSD Short Gold vs US Dollar

GOLD (XAU/USD) MACRO RALLY & HEAVY RESISTANCE REJECTION SETUP

Executive Summary & Macro Narrative Following a soft US Non-Farm Payrolls (NFP) report showing an unexpected decline in payroll data, weak labor market dynamics have intensified market expectations for aggressive central bank interest rate cuts. The resulting downward pressure on the US Dollar and Treasury yields has fueled a massive macro surge in XAU/USD (Gold) , driving price action directly into a major higher-timeframe resistance supply block around $4,450.00 on the 4-Hour (H4) chart. While the fundamental NFP shock provides immediate bullish momentum toward the $4,450 level, this key structural zone represents strong overhead supply and liquidity. A decisive rejection and drop from this major supply block are projected as buyers take profits and the market seeks to rebalance
Simple Trading Setup with Two Simple Moving Averages GBPUSD Pound Sterling vs US Dollar

Simple Trading Setup with Two Simple Moving Averages

A simple and reliable educational setup. When the 50 SMA crosses above the 200 SMA from below, it signals a potential bullish move. When it crosses below from above, a bearish move may follow. Signals are rare but long-term. Adding Stochastic (55,8,8) helps confirm the momentum - look for it turning above 20 for longs or below 80 for shorts. This is an example about how two moving averages can define the trend.
Money Flow Index - traditional general approach USDSGD US Dollar vs Singapore Dollar

Money Flow Index - traditional general approach

Money Flow Index (MFI) is a momentum indicator that measures the rate at which money is invested into or withdrawn from a security. Traditional general approach to use MFI is the using it as the Trend Filter: MFI (14) + Simple Moving Average (SMA with period 200) on the price chart. Buy Rule (Long) : price is above the SMA. Wait for the MFI to drop below 20 (oversold) and start rising. Sell Rule (Short) : price is below the SMA. Wait for the MFI to rise above 80 (overbought) and start falling. Traders often monitor these zones for potential price peaks or bottoms.
Avesome Oscillator - traditional general approach USDBRL US Dollar vs Brazilian Real

Avesome Oscillator - traditional general approach

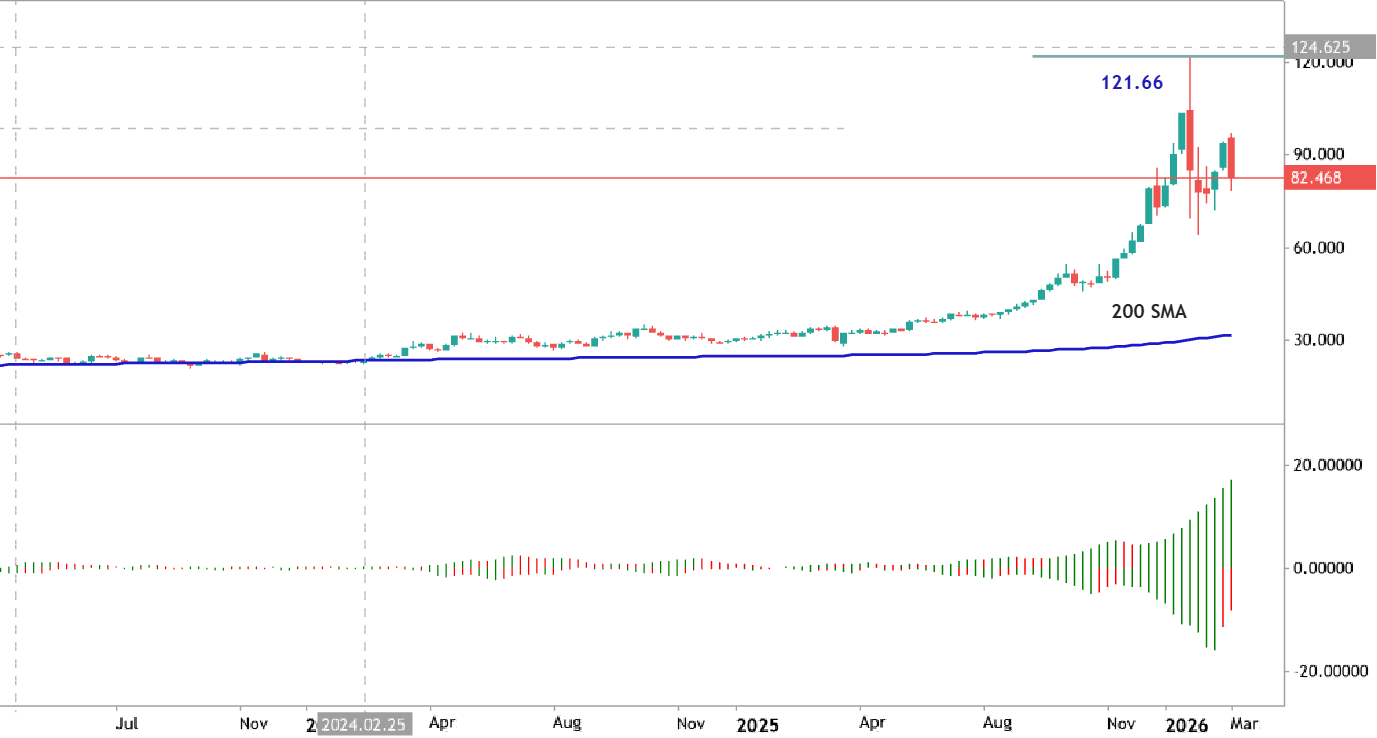
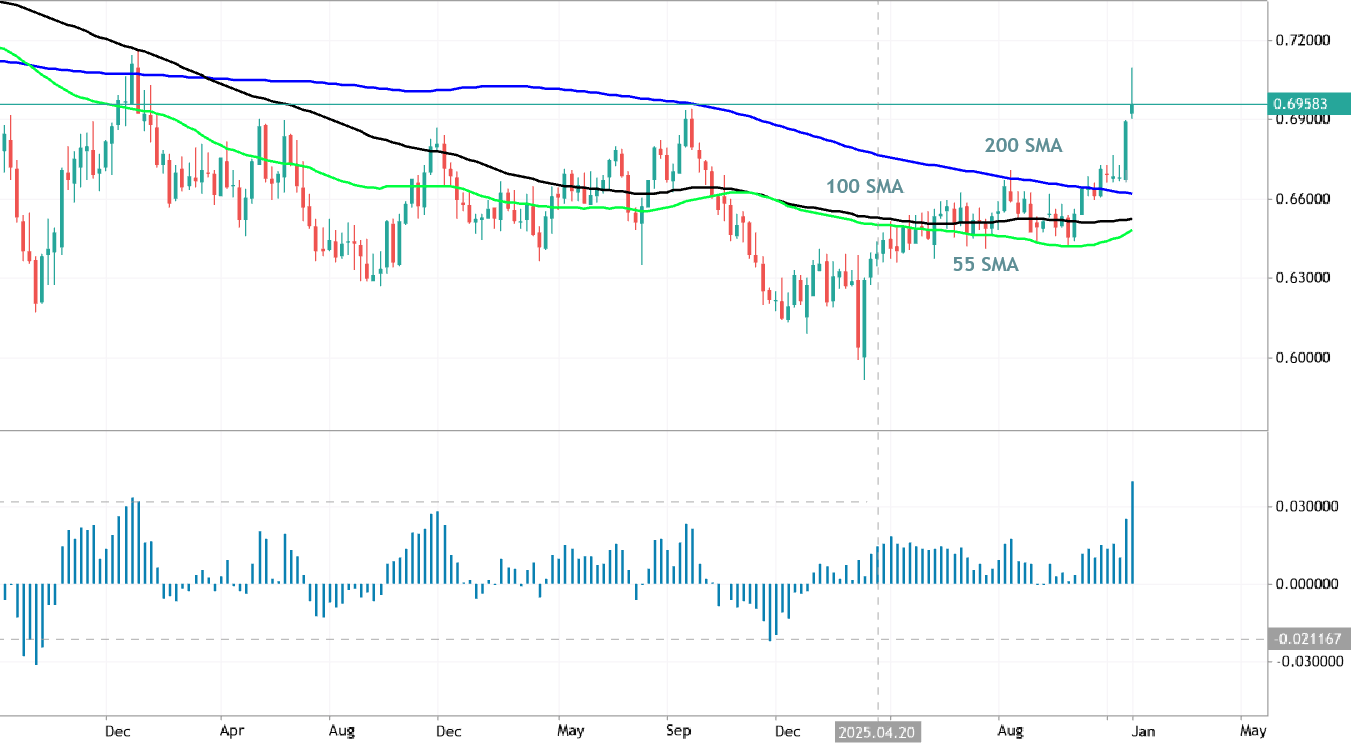
Awesome Oscillator (AO) is a momentum indicator that reflects market trend changes by comparing recent market velocity with historical velocity. The traditional trading approach focuses on capturing macro-driven trends and avoiding false breakouts caused by the pair's typical high volatility. Zero-Line Crossover This is the simplest trend-following signal indicating a shift in market direction. Bullish Signal (Buy): AO crosses from below zero to above zero. Bearish Signal (Sell): AO crosses from above zero to below zero. Apply Filter It can be 200-SMA or Ichimoku cloud for example. Only look for Buy signals if the price is above the 200-SMA or Ichimoku cloud. Only look for Sell signals if the price is below the 200-SMA or Ichimoku cloud. Best used on daily (D1) charts to capture large
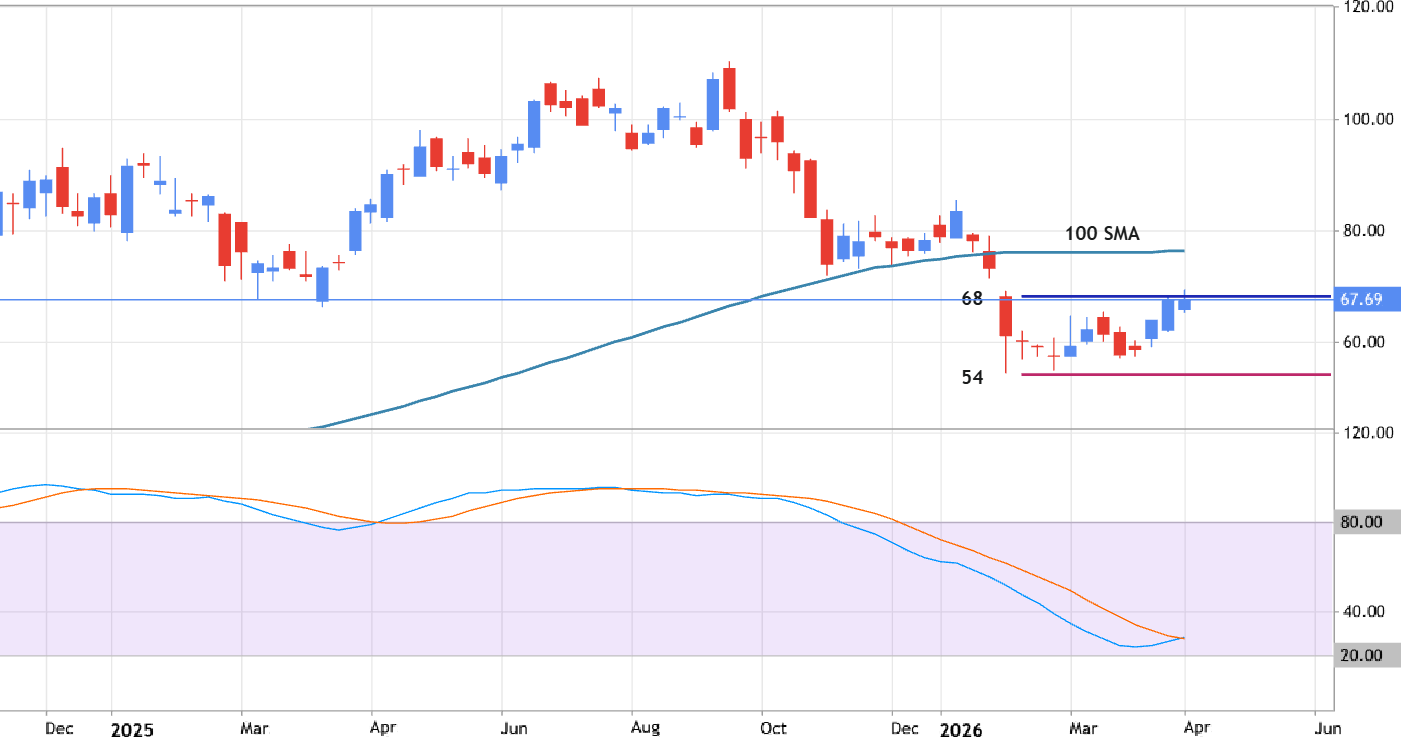
RVI - traditional general approach USDKRW US Dollar vs South korean won

RVI - traditional general approach

Relative Vigor Index (RVI) measures the strength of a price trend by comparing a currency pair's closing price. It operates on the core logic that, in bullish markets, prices tend to close higher than they open, while in bearish markets, they close lower. RVI displays two lines: green line (which is the main RVI oscillator line) and red line (the signal line). Buy Signal: the green RVI line crosses above the red signal line. Sell Signal: the green RVI line crosses below the red signal line. Those crossover signals are more reliable in the direction of the main primary trend - primary bullish and primary bearish, for example - above/below or on the direction of 100 SMA.
Smma cross + Breakout XAUUSD Gold vs US Dollar

Smma cross + Breakout

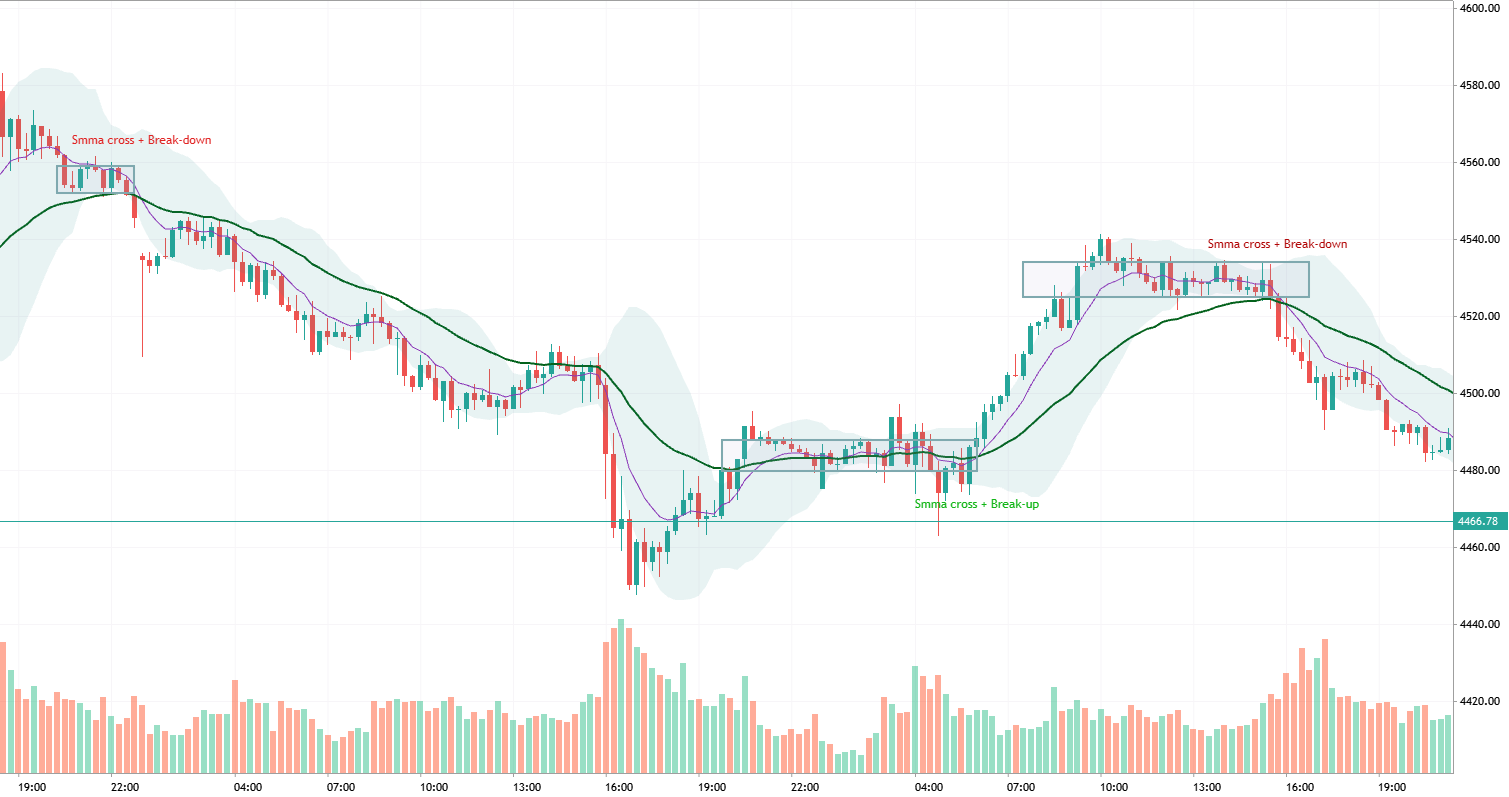
SMMA Cross + Breakout Confirmation Strategy Trading Idea Market Analysis The market is currently transitioning from consolidation into a potential trend phase. This setup combines SMMA crossover signals with range breakout confirmation to identify higher-probability trading opportunities. Bullish Scenario Fast SMMA crosses above Slow SMMA. Price consolidates within a defined range. A candle closes above resistance. Volume and momentum support the breakout. Key Levels Range Resistance: Breakout Trigger Range Support: Invalidation Level Previous Swing High: Target Area Invalidation Price closes back inside the range. Fast SMMA crosses below Slow SMMA. Bearish Scenario Fast SMMA crosses below Slow SMMA. Price consolidates before breaking support. Downside breakout confirms bearish momentum
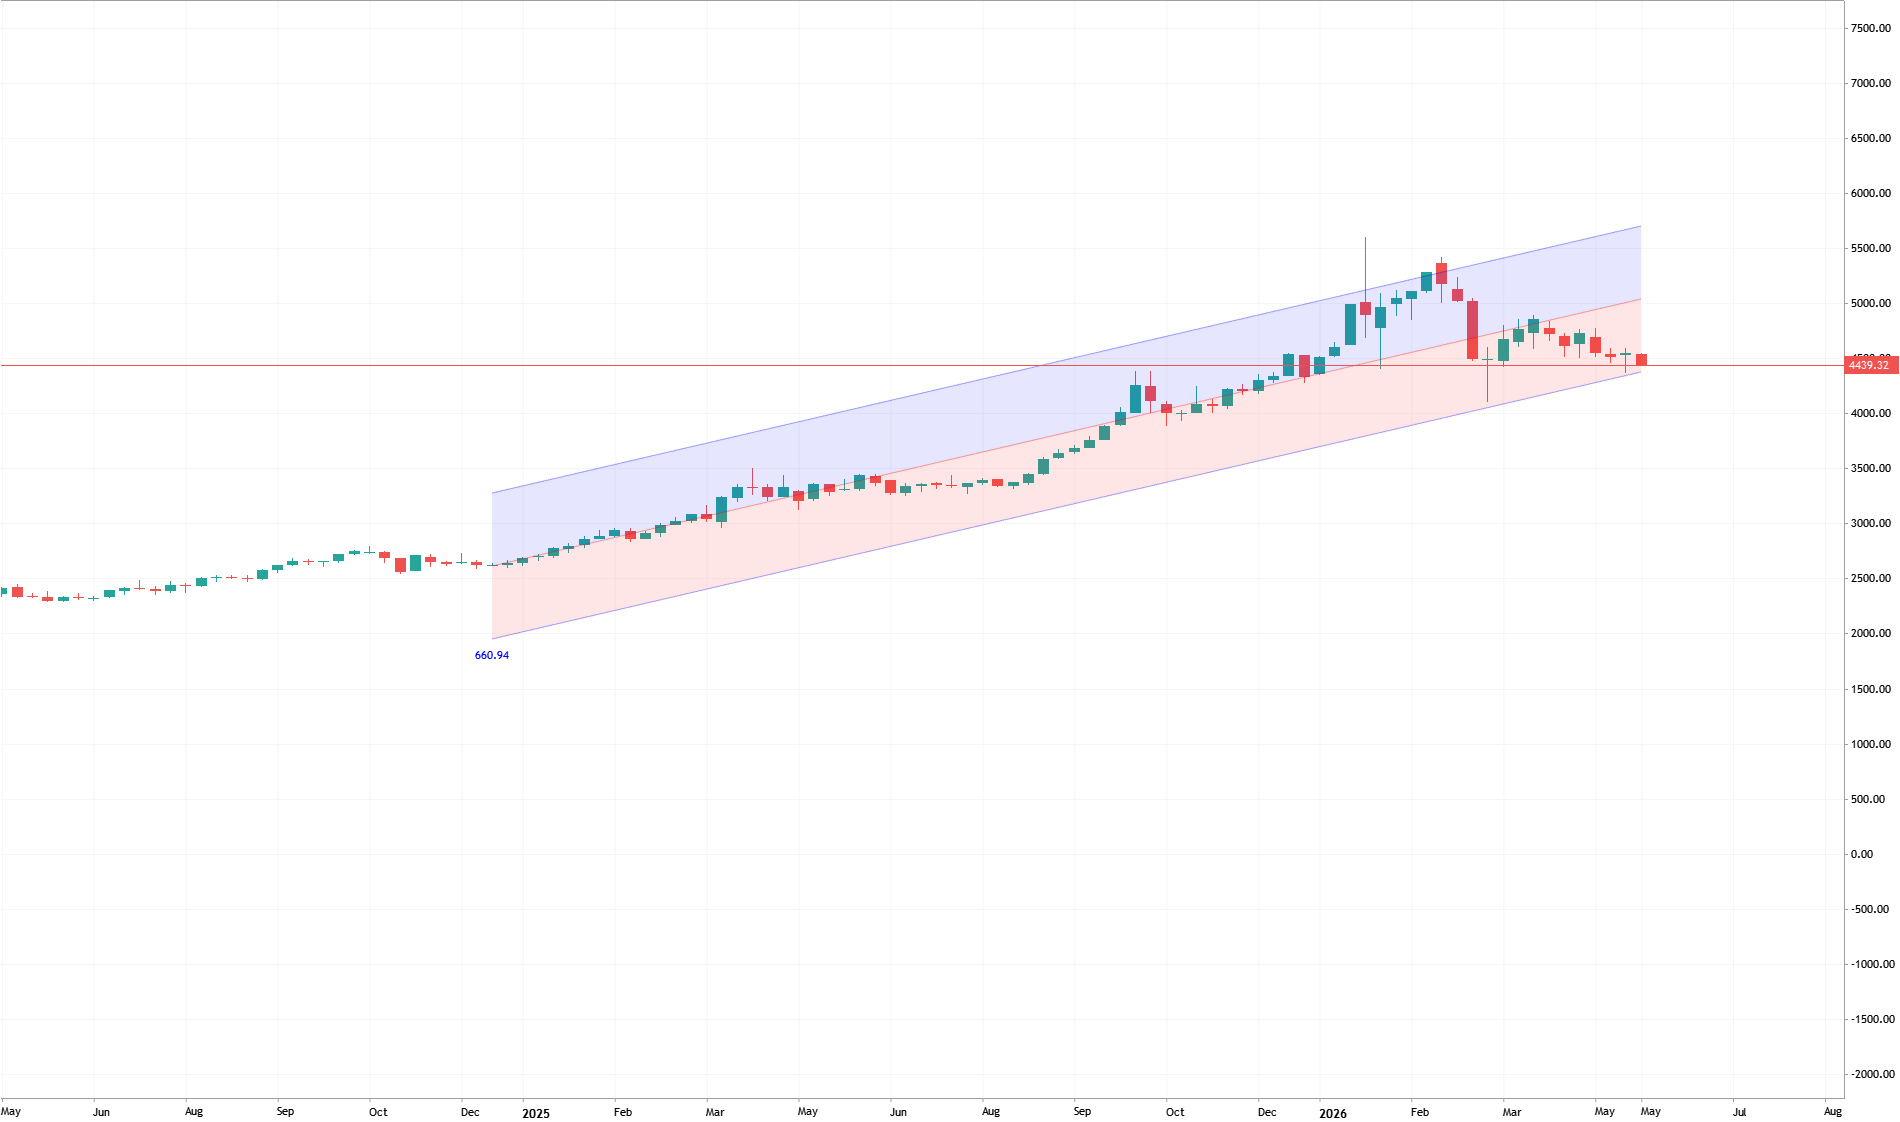
XAUUSD (Gold) Weekly Linear Regression Channel (Length 100) XAUUSD Short Gold vs US Dollar

XAUUSD (Gold) Weekly Linear Regression Channel (Length 100)

1. Multi-Timeframe Diagnosis Weekly (Length 100): Price is testing the lower channel boundary (-2SD) . This is a critical macro support level determining the 2-year trend. Daily / Intraday: Strictly bearish (lower highs and lower lows). No buying pressure is observed despite hitting the weekly floor. 2. Market Outlook High Breakdown Probability: Since lower timeframes maintain strong bearish momentum, the weekly support is highly vulnerable. Expected Move: A sharp downward price extension is likely as macro support fails and triggers stop-losses. 3. Tactical Strategy No Blind Buying: Avoid catching a falling knife just because the price seems low. Short Strategy: Follow the trend and short if the price decisively closes below the weekly -2SD line. Long Strategy: Wait for confirmation. Only
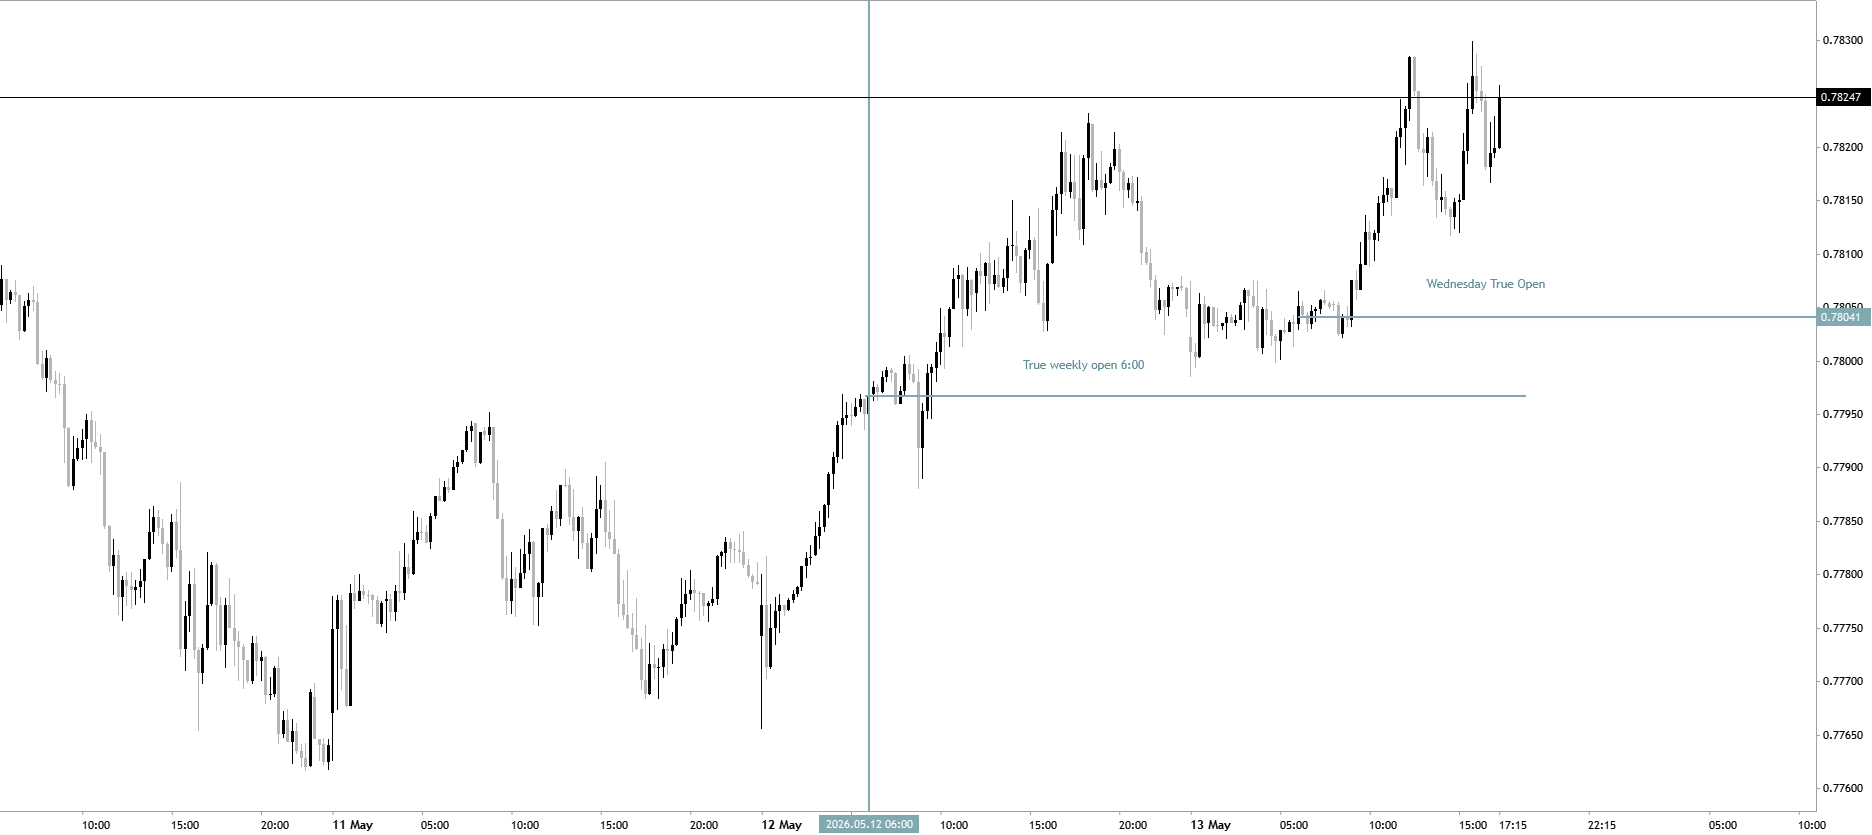
Algorithmic Cycle Theory: Exploiting True Opens on USDCHF USDCHF Long US Dollar vs Swiss Franc

Algorithmic Cycle Theory: Exploiting True Opens on USDCHF

Retail traders chase price using lagging indicators. Institutional algorithms track time and liquidity. In this M15 USDCHF breakdown, I am sharing a core component of the Meridius Quant Cycle Theory: The strict mathematical interaction between the True Weekly Open and the Wednesday True Open . If you look closely at the data delivery: The Genesis (True Weekly Open - 6:00): This is not a random support line; it is the anchor of the weekly algorithmic cycle. Notice how price accumulates and expands aggressively from this precise temporal injection point. The Continuation Pivot (Wednesday True Open): Mid-week, the algorithm temporarily pauses expansion to re-accumulate and balance the book. The Wednesday Open acts as a strict fair-value threshold. Price retraces, perfectly tags this level
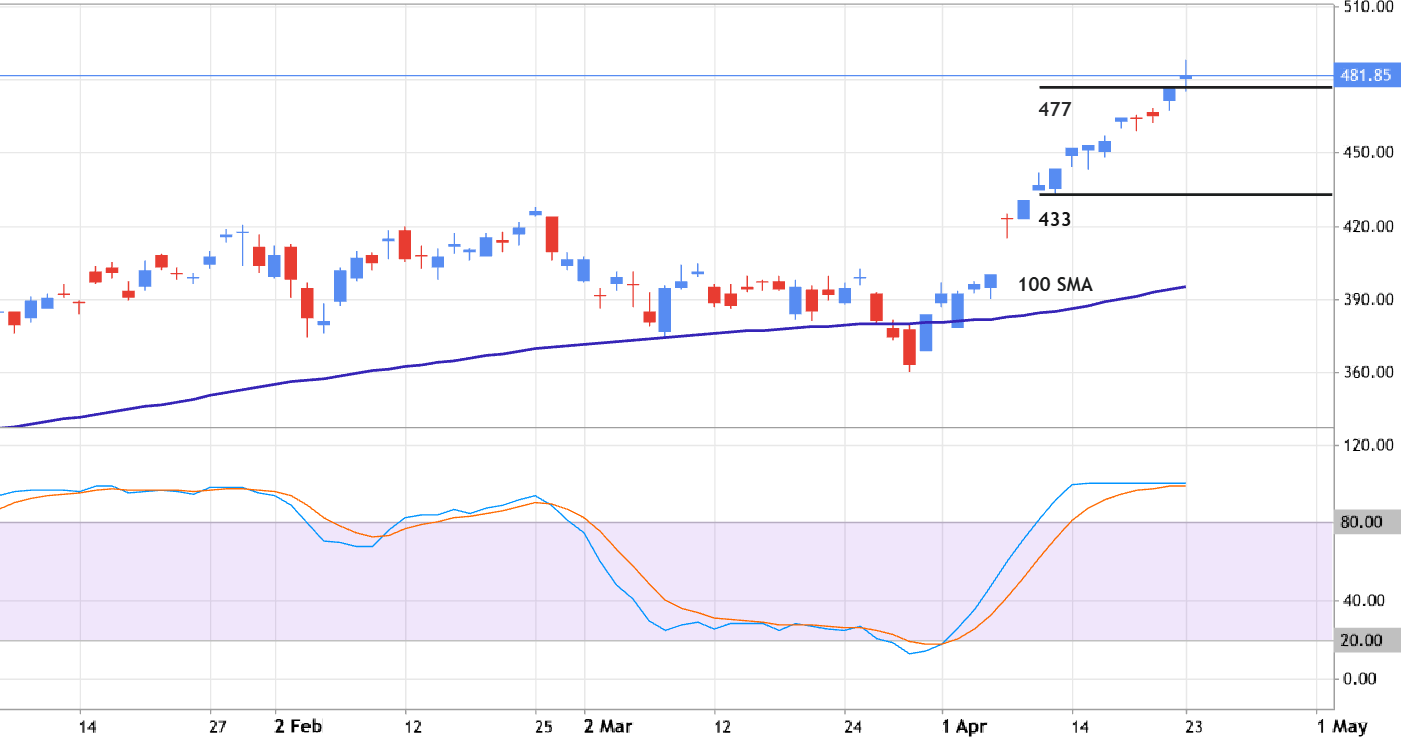
Stochastics - traditional general approach to identify the short-term reversals SMH VanEck Semiconductor ETF

Stochastics - traditional general approach to identify the short-term reversals

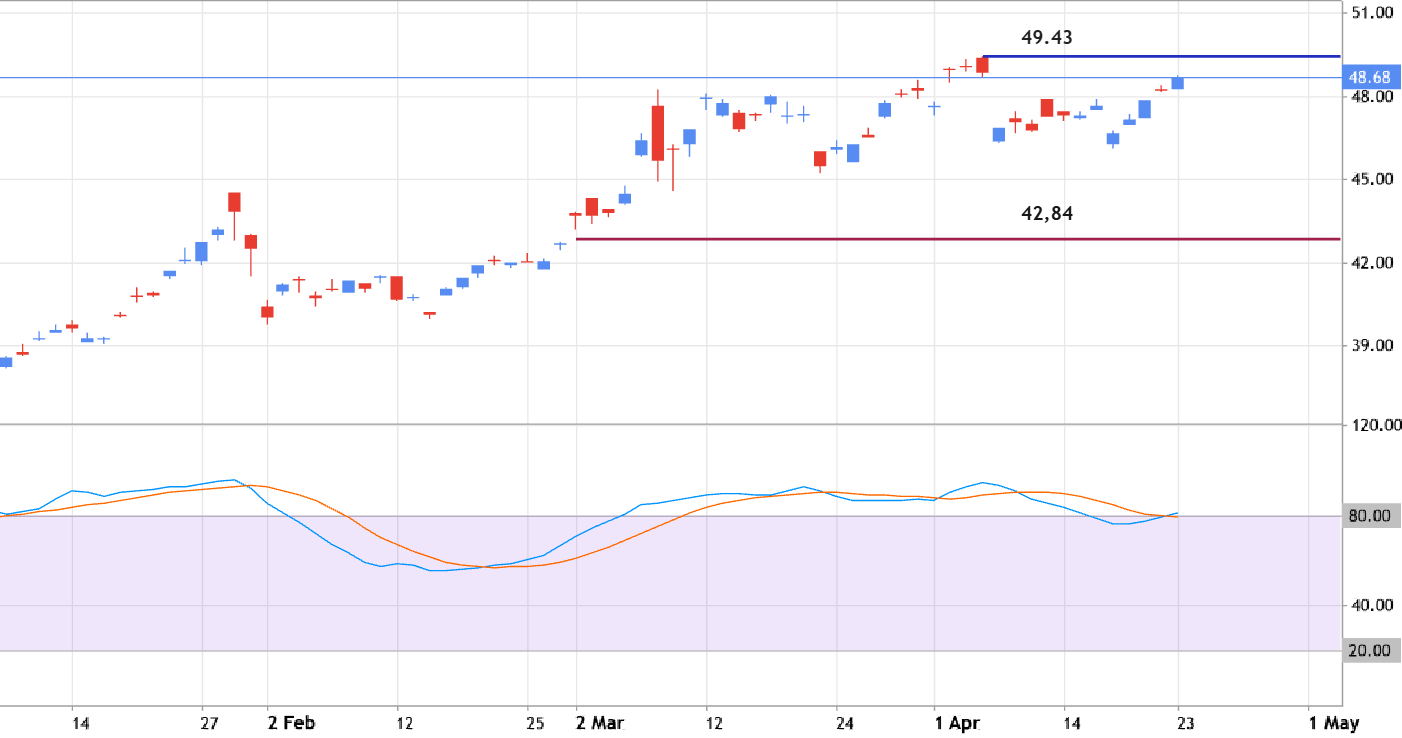
Stochastic with 34-5-5 settings is the "fast" version of it, and it is used to identify the possible reversals in short-term situation and/or in lower timeframes for example: overbought/oversold market condition in the current market for example. It is used with the other indicators for trading such as 55 SMA, 100 SMA, "medium"/"slow" version of Stochastic and more.