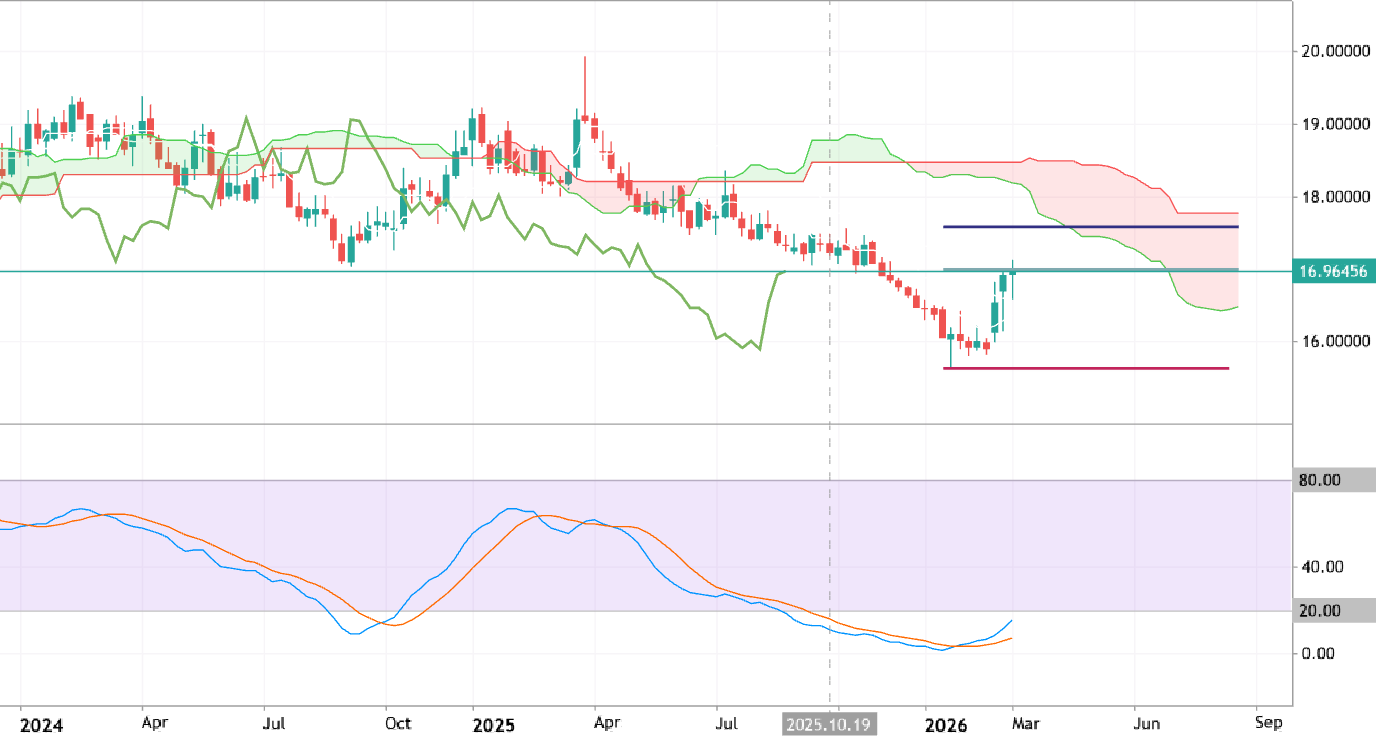
Weekly price is located below Ichimoku cloud in the bearish area of the chart. The price was bounced from support level at 15.63 to above for the bear market rally to be started for trying to break the resistance at 17.00 to above for the secondary rally to be continuing. Stochastic oscillator is indicating the oversold level of the price, and Chinkou Spam line of Ichimoku indicator is located to be near historical price from below to be ready to cross it to above for the good breakout to be started. If the price breaks 17.00 resistance to above on weekly close bar so the breakout may be started with the 17.57 bullish reversal target to re-enter, or the price will be on secondary ranging waiting for the direction of the good trend to e started. Trading Summary: future possible breakout with the bullish reversal, alternatively - ranging within s/r channel for direction.
The price was bounced from resistance level at 17.00 to below for secondary ranging within the primary bearish trend to be started and with 15.63 possible target to re-enter. Alternatively, the price will be located within s/r channel waiting for direction.

Neuer Kommentar
I want to trade can someone tutor me for 3 days
if you don't mind i can be your mentor
The price was bounced from resistance level at 17.00 to below for secondary ranging within the primary bearish trend to be started and with 15.63 possible target to re-enter. Alternatively, the price will be located within s/r channel waiting for direction.