
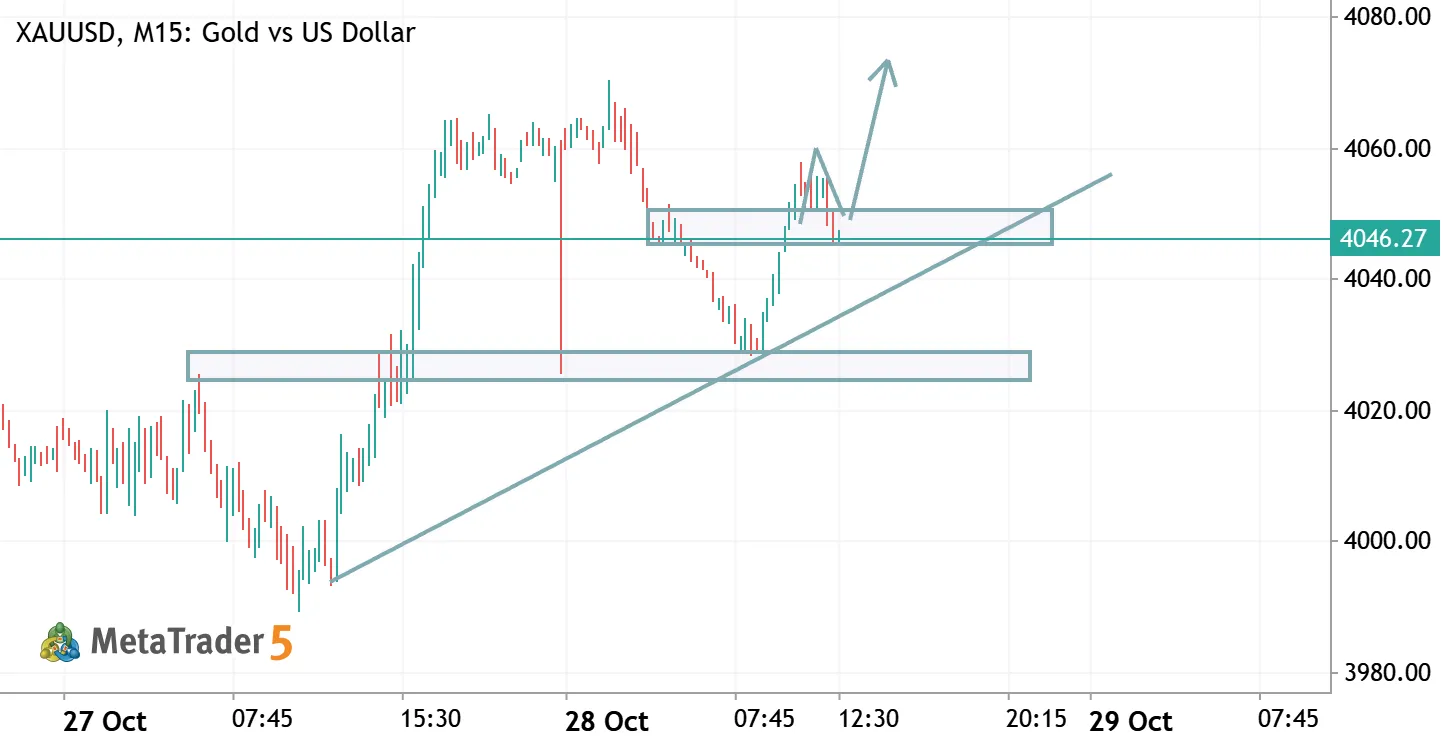
XAUUSD Bullish Continuation / Support Retest Setup
Setup Overview
- Instrument: XAUUSD (Gold vs. US Dollar)
- Timeframe: M15 (15-minute chart)
- Direction: Bullish / Long Bias (following a retest of structural support)
Analysis & Reasons
- Uptrend Structure & Trendline:
- The price action displays an ascending trendline starting from the low near 3992 (around 11:30 on the previous session) extending upwards, respecting higher lows.
- The chart shows a strong impulse wave moving up, breaking through prior local resistance zones, and establishing a bullish market structure.
- Support Zones (Order Blocks / Flip Zones):
- Immediate Support (Upper Box): Located roughly between 4045 and 4050, which previously acted as resistance/consolidation and has now been breached. Price is projected to retest this zone.
- Major Support (Lower Box): Located around the 4025 to 4030 region, aligning with the rising trendline confluence.
- Projected Path:
- The drawn-out forecast arrows suggest a short-term pullback or correction toward the upper support box/trendline area (~4045–4050), followed by a bounce and a continuation of the upward trajectory toward higher targets above 4070.
Disclaimer: This analysis is strictly for educational and informational purposes only and does not constitute financial advice. Trading leveraged financial instruments like spot gold (XAUUSD) carries a high level of risk, and you should always conduct your own due diligence or consult with a qualified financial advisor before executing any trades.

 MQL5-Profil

Neuer Kommentar