
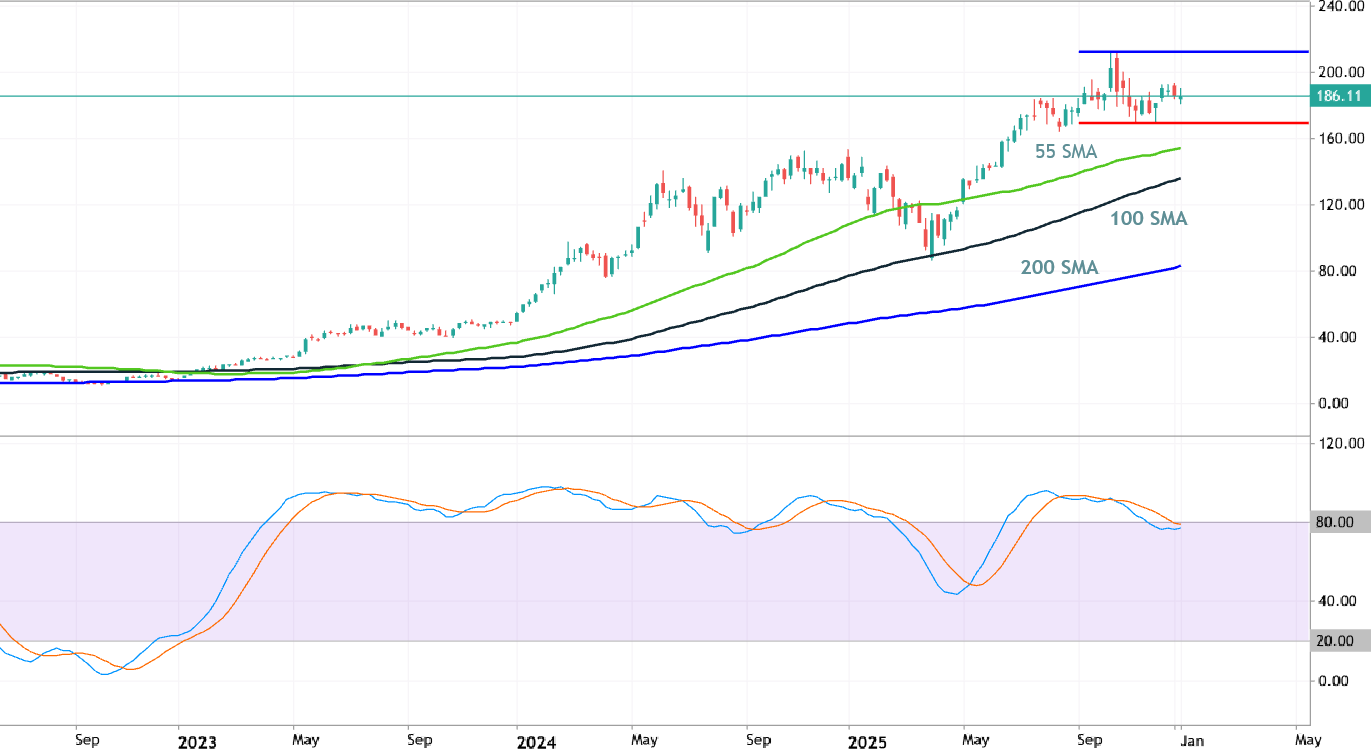
Weekly price is located above SMA indicators in the bullish area of the chart. The price is on ranging within 169.4 support level and 212.0 resistance level. If the price breaks support level at 169.4 to below so the secondary correction within the primary bullish trend will be started; if the price crosses resistance level at 212.0 to above so the good bullish trend will be continuing. Recommendation: ranging for direction.
2026.01.17 08:45
2

Neuer Kommentar
The price was broke 212.0 resistance level to above for the secondary ranging to be started.
The price is still located within 169.4/212.0 s/r channel waiting for the bullish trend to be continuing or for the secondary correction to be started.
Trading Summary: ranging