

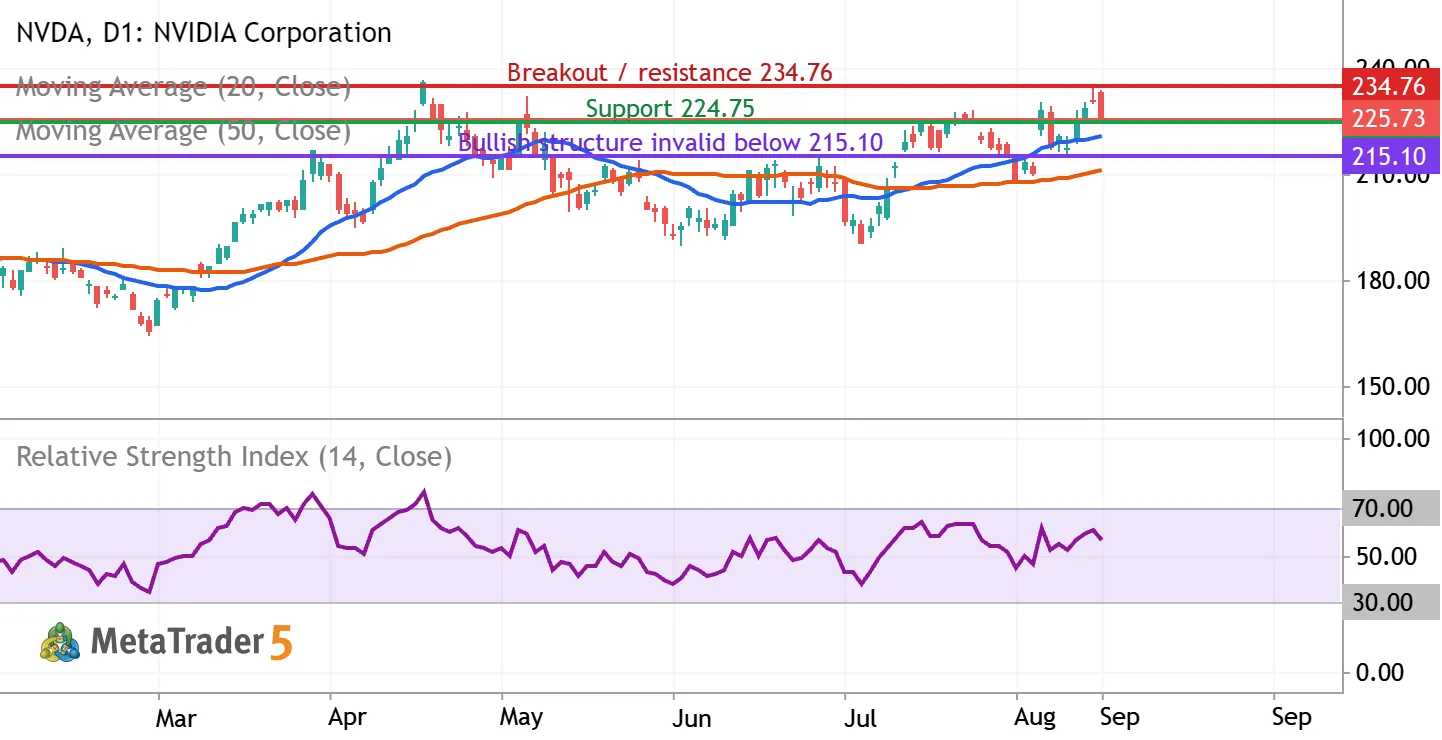
NVIDIA (NASDAQ: NVDA) | Daily chart | September 9, 2026
Bias: conditionally bullish over the next 2–6 weeks. Entry confirmation is still required. The latest completed regular session, September 8, closed at $225.73, down 2.01%, after reaching $233.71 intraday. The close near the session low signals selling pressure despite the broader recovery.
What the indicators show
The chart includes a blue 20-day simple moving average, an orange 50-day simple moving average, and purple RSI(14), all calculated from closing prices. At the latest completed candle, MetaTrader showed the averages near $220.48 and $211.22, with RSI near 56.19. Price remains above both rising averages, and the 20-day average is above the 50-day average. RSI above 50 supports positive momentum, but its reading below 70 is not, by itself, a buy signal.
Three levels marked on the chart
Green $224.75: the September 3 low, close to September 8’s $224.85 low. This is the immediate support test.
Red $234.76: the September 4 high and the breakout threshold. The $230.40–230.47 area is an intermediate obstacle.
Purple $215.10: the September 1 low. A daily close below it invalidates this bullish swing thesis.
Preferred trading setup
First, look for $224.75 to hold on a daily closing basis and for price to reclaim $228.50. Then consider a pullback into $226.50–227.50 only if buyers defend that retest and RSI remains above 50. An illustrative entry at $227 with a protective stop at $223.50 risks $3.50 per share. The first target is $234.75, approximately 2.2 times the initial risk before costs. This trade is not activated by the current close alone.
A sustained daily breakout above $234.76, followed by a successful retest, would support a further objective near $244.75: a projection of the approximately $10 range between the green and red lines. This is a conditional extension, not an established resistance level or a guaranteed target. If the first target rejects price, protect gains rather than assuming continuation.
If support fails
Losing $224.75 would increase the chance of a test of the 20-day average near $220.50, then $215.10. The trade stop at $223.50 controls the example entry; the lower purple line governs the broader thesis. Do not widen the trade stop to the structural level.
Business backdrop
NVIDIA’s August 26 release reported Q2 FY2027 revenue of $96.2 billion, up 106% year over year, and Data Center revenue of $89.0 billion. Q3 revenue guidance was $108 billion, plus or minus 2%, with no China Data Center compute revenue assumed. My interpretation: demand supports the growth case, while export restrictions, customer spending concentration, and high expectations remain risks to the share price.
Risk and sources
Size from a predetermined loss budget and the entry-to-stop distance. Gaps and slippage can exceed planned losses. Reassess if confirmation does not develop within the stated horizon. Educational market analysis, not personalized investment advice.
Daily prices: https://stockanalysis.com/stocks/nvda/history/
Company results: https://investor.nvidia.com/news/press-release-details/2026/NVIDIA-Announces-Financial-Results-for-Second-Quarter-Fiscal-2027/default.aspx
Indicators and annotated chart: MetaTrader. Trading scenarios are the author’s analysis.

 MQL5-Profil
Neuer Kommentar