
Linde plc LIN reported first-quarter 2026 adjusted earnings per share (EPS) of $4.33, up 10% from $3.95 a year ago. The figure topped the Zacks Consensus Estimate of $4.27 by 1.41%.
Total quarterly revenues of $8.78 billion rose 8% from $8.11 billion recorded in the year-ago period. The top line beat the Zacks Consensus Estimate of $8.51 billion by 3.17%.
The strong quarterly results can be attributed to higher pricing and incremental project start-ups, which supported underlying growth.
Linde PLC Price, Consensus and EPS Surprise
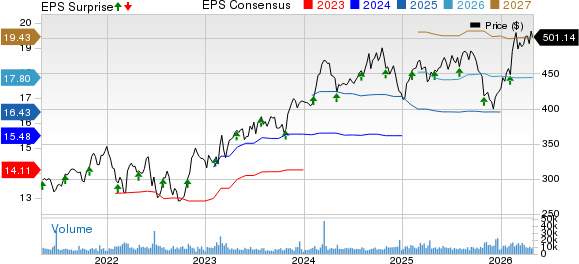
Linde PLC price-consensus-eps-surprise-chart | Linde PLC Quote
LIN Leans on Price Attainment and Project Start-Ups
The top-line beat was driven by a mix of operational factors. Compared with the prior-year quarter, underlying sales increased 3%, supported by 2% price attainment and 1% volume growth, driven by project start-ups. Acquisitions added another 1% to sales growth.
LIN Protects Operating Leverage Despite Macro Friction
Linde reported operating profit of $2.44 billion and adjusted operating profit of $2.63 billion, up from $2.18 billion and $2.44 billion, respectively, recorded in the prior-year quarter.
Net income attributable to Linde increased from the year-ago figure of $1.67 billion to $1.86 billion. The company’s adjusted net income was $2.02 billion, up 7% year over year from $1.88 billion, reflecting stronger operating profit and ongoing productivity initiatives across segments.
LIN’s Segmental Highlights
Geographically, the Americas remained the key growth contributor, with segment sales of $4.03 billion, up 10% year over year from $3.67 billion. The increase was supported by stronger pricing and higher volumes, with electronics and manufacturing highlighted as key end markets. Segment operating profit reached $1.27 billion, up from $1.14 billion recorded in the year-ago quarter.
APAC sales rose to $1.70 billion, reflecting an 11% increase from $1.54 billion a year ago. Volumes were the main driver, aided by project start-ups and demand in electronics, as well as chemicals and energy. Segment operating profit increased from $451 million to $477 million for the quarter.
EMEA sales amounted to $2.17 billion, up 7% from the year-ago quarter’s figure of $2.03 billion. Underlying performance was less favorable, with volume pressure in chemicals, energy and manufacturing offsetting pricing gains. Segment operating profit improved to $784 million from $722 million recorded in the prior-year quarter.
Engineering sales decreased from $565 million in the prior-year quarter to $517 million. Operating profit in the Engineering segment declined to $101 million from $114 million in the prior-year quarter.
LIN’s Backlogs
At the end of the first quarter, the company’s high-quality project backlog amounted to $10.1 billion, comprising a sale-of-gas backlog of $7.1 billion.
Linde’s Cash Generation Supports Shareholder Returns
Cash flow remained supportive of capital returns and investment priorities. First-quarter operating cash flow was $2.24 billion, up 4% from $2.16 billion in the prior-year quarter. Capital expenditures totaled $1.34 billion, resulting in free cash flow of $898 million.
Capital deployment was directed toward returning cash to shareholders alongside continued growth investment. During the quarter, Linde returned $1.55 billion through dividends and stock repurchases, net of issuances. The company has raised its dividend by 7% in 2026, marking 33 consecutive years of dividend increases.
LIN’s 2026 Guidance
Management’s near-term and full-year guidance remained centered on steady execution rather than a sharp demand rebound. For the second quarter of 2026, Linde expects EPS to be in the range of $4.40-$4.50, implying 8% to 10% growth versus the prior-year quarter, or 7% to 9% excluding an estimated 1% currency benefit.
For full-year 2026, EPS is expected to be in the range of $17.60-$17.90, suggesting 7-9% growth and assuming a 1% favorable currency impact.
Capital expenditures are expected to be between $5.0 billion and $5.5 billion, reflecting both maintenance needs and growth spending tied to the company’s contractual project pipeline.
LIN’s Zacks Rank & Key Picks
LIN currently carries a Zacks Rank #3 (Hold).
Some better-ranked stocks from the basic materials sector are Dow Inc. DOW, CF Industries Holdings, Inc. CF and Nutrien Ltd. NTR. Both DOW and CF sport a Zacks Rank #1 (Strong Buy) at present, while NTR carries a Zacks Rank #2 (Buy). You can see the complete list of today’s Zacks #1 Rank stocks here.
Dow reported a first-quarter 2026 loss of 14 cents per share, narrower than the Zacks Consensus Estimate of a loss of 39 cents.
As of March 31, 2026, DOW reported $4.1 billion in cash and cash equivalents. At the quarter's end, its long-term debt amounted to $17.3 billion.
CF Industries is the largest producer of ammonia globally. The company is scheduled to release first-quarter 2026 earnings on May 7. The Zacks Consensus Estimate for CF’s earnings is pegged at $2.35 per share, which implies an increase of 27% from the prior-year reported figure.
Nutrien, based in Canada, is a leading integrated provider of crop inputs and services. NTR is scheduled to release first-quarter 2026 earnings on May 6. The Zacks Consensus Estimate for NTR’s earnings is pegged at 48 cents per share, which implies an increase of 336.4% from the prior-year reported figure.
Beyond Nvidia: AI's Second Wave Is Here
The AI revolution has already minted millionaires. But the stocks everyone knows about aren't likely to keep delivering the biggest profits. Little-known AI firms tackling the world's biggest problems may be more lucrative in the coming months and years.
See Stocks Now >>Want the latest recommendations from Zacks Investment Research? Today, you can download 7 Best Stocks for the Next 30 Days. Click to get this free report
Dow Inc. (DOW): Free Stock Analysis Report
CF Industries Holdings, Inc. (CF): Free Stock Analysis Report
Linde PLC (LIN): Free Stock Analysis Report
Nutrien Ltd. (NTR): Free Stock Analysis Report
This article originally published on Zacks Investment Research (zacks.com).