Darden Q2 Earnings Lag Estimates, Revenues Surpass, Stock Up

Darden Restaurants, Inc. DRI reported second-quarter fiscal 2026 results, with earnings missing the Zacks Consensus Estimate, but revenues beat the same. Following the results, the stock rose 5% in today’s pre-market trading session.
DRI’s Fiscal Q2 Earnings & Revenues
During the fiscal second quarter, Darden reported adjusted earnings per share (EPS) of $2.08, missing the Zacks Consensus Estimate of $2.09. In the prior-year quarter, DRI reported an adjusted EPS of $2.03.
Total sales during the quarter were $3,102.1 million, surpassing the consensus mark of $3,084 million. Sales increased 7.3% from the prior-year quarter’s level. This upside was backed by a blended same-restaurant sales increase of 4.3%. Also, contributions from 30 net new restaurants added to the positives.
Darden Restaurants, Inc. Price, Consensus and EPS Surprise
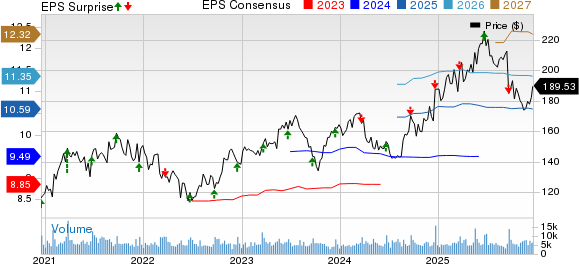
Darden Restaurants, Inc. price-consensus-eps-surprise-chart | Darden Restaurants, Inc. Quote
DRI’s Sales by Segments
Darden reports business under four segments — Olive Garden, LongHorn Steakhouse, Fine Dining, including The Capital Grille and Eddie V's, and Other Business.
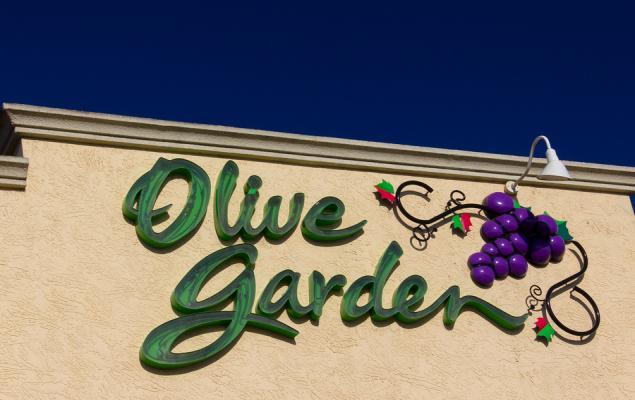
During the fiscal second quarter, sales at Olive Garden increased 5.4% year over year to $1.36 billion. Our estimate for the metric was $1.33 billion. Comps in the segment increased 4.7% year over year compared with a 5.9% rise reported in the previous quarter.
At LongHorn Steakhouse, sales were up 9.3% year over year to $775.9 million. Our estimate for the metric was $750.7 million. Comps in the segment rose 5.9% year over year compared with 5.5% growth reported in the previous quarter.
Sales in Fine Dining increased 3.3% year over year to $316.4 million. Our estimate for the metric was $302 million. Comps in the segment rose 0.8% year over year against a 0.2% drop reported in the previous quarter.
Sales in Other Business increased 11.3% year over year to $647.3 million. Our estimate for the metric was $686.8 million. Comps in the Other Business rose 3.1% year over year compared with a 3.3% rise reported in the previous quarter.
DRI’s Q2 Operating Highlights
In the fiscal second quarter, total operating costs and expenses inched up 7.1% year over year to $2.78 billion. The upside was primarily due to increased food and beverage expenses, restaurant expenses, labor costs and marketing expenses. The figure missed our projection of $2.75 billion.
DRI’s Balance Sheet
As of Nov. 23, 2025, cash and cash equivalents were $224.1 million compared with $240 million as of May 25, 2025.
During the fiscal second quarter, inventories were $354.5 million compared with $311.6 million reported in the previous quarter. As of Nov. 23, 2025, long-term debt was $2.14 billion compared with $2.13 billion as of May 25, 2025.
Darden’s Fiscal 2026 Outlook
For fiscal 2026, the company expects total sales growth of 8.5% to 9.3% (compared with the prior estimate of 7.5% to 8.5%), including approximately 2% growth related to the 53rd week. Same-restaurant sales growth in fiscal 2026 is anticipated to be between 3.5% and 4.3% year over year compared with the earlier estimate of 2.5% to 3.5%. Adjusted diluted EPS from continuing operations continues to be anticipated in the band of $10.50-$10.70.
The company expects to open approximately 65 to 70 net new restaurants and a total capital spending of $750-$775 million in fiscal 2026.
DRI’s Zacks Rank
Darden currently carries a Zacks Rank #3 (Hold).
Stocks to Consider
Some better-ranked stocks in the Zacks Retail-Wholesale sector are:
El Pollo Loco Holdings, Inc. LOCO presently sports a Zacks Rank #1 (Strong Buy). You can see the complete list of today’s Zacks #1 Rank stocks here.
The company delivered a trailing four-quarter earnings surprise of 19.6%, on average. LOCO stock has fallen 3.2% year to date. The Zacks Consensus Estimate for LOCO’s 2026 sales and EPS indicates growth of 1.3% and 4.2%, respectively, year over year.
Dillard's, Inc. DDS sports a Zacks Rank #1 at present. The company delivered a trailing four-quarter earnings surprise of 26.5%, on average. DDS stock has rallied 50.1% year to date.
The Zacks Consensus Estimate for Dillard’s 2026 sales implies growth of 0.7%, while that for EPS implies a decline of 8.2% year over year.
Expedia Group, Inc. EXPE sports a Zacks Rank #1 at present. The company delivered a trailing four-quarter earnings surprise of 4.5%, on average. EXPE stock has gained 51.8% year to date.
The Zacks Consensus Estimate for EXPE’s 2026 sales and EPS indicates growth of 6.3% and 20.8%, respectively, year over year.
Zacks Naming Top 10 Stocks for 2026
Want to be tipped off early to our 10 top picks for the entirety of 2026? History suggests their performance could be sensational.
From 2012 (when our Director of Research Sheraz Mian assumed responsibility for the portfolio) through November, 2025, the Zacks Top 10 Stocks gained +2,530.8%, more than QUADRUPLING the S&P 500’s +570.3%.
Now Sheraz is combing through 4,400 companies to handpick the best 10 tickers to buy and hold in 2026. Don’t miss your chance to get in on these stocks when they’re released on January 5.
Be First to New Top 10 Stocks >>Want the latest recommendations from Zacks Investment Research? Today, you can download 7 Best Stocks for the Next 30 Days. Click to get this free report
Dillard's, Inc. (DDS): Free Stock Analysis Report
Darden Restaurants, Inc. (DRI): Free Stock Analysis Report
Expedia Group, Inc. (EXPE): Free Stock Analysis Report
El Pollo Loco Holdings, Inc. (LOCO): Free Stock Analysis Report
This article originally published on Zacks Investment Research (zacks.com).