


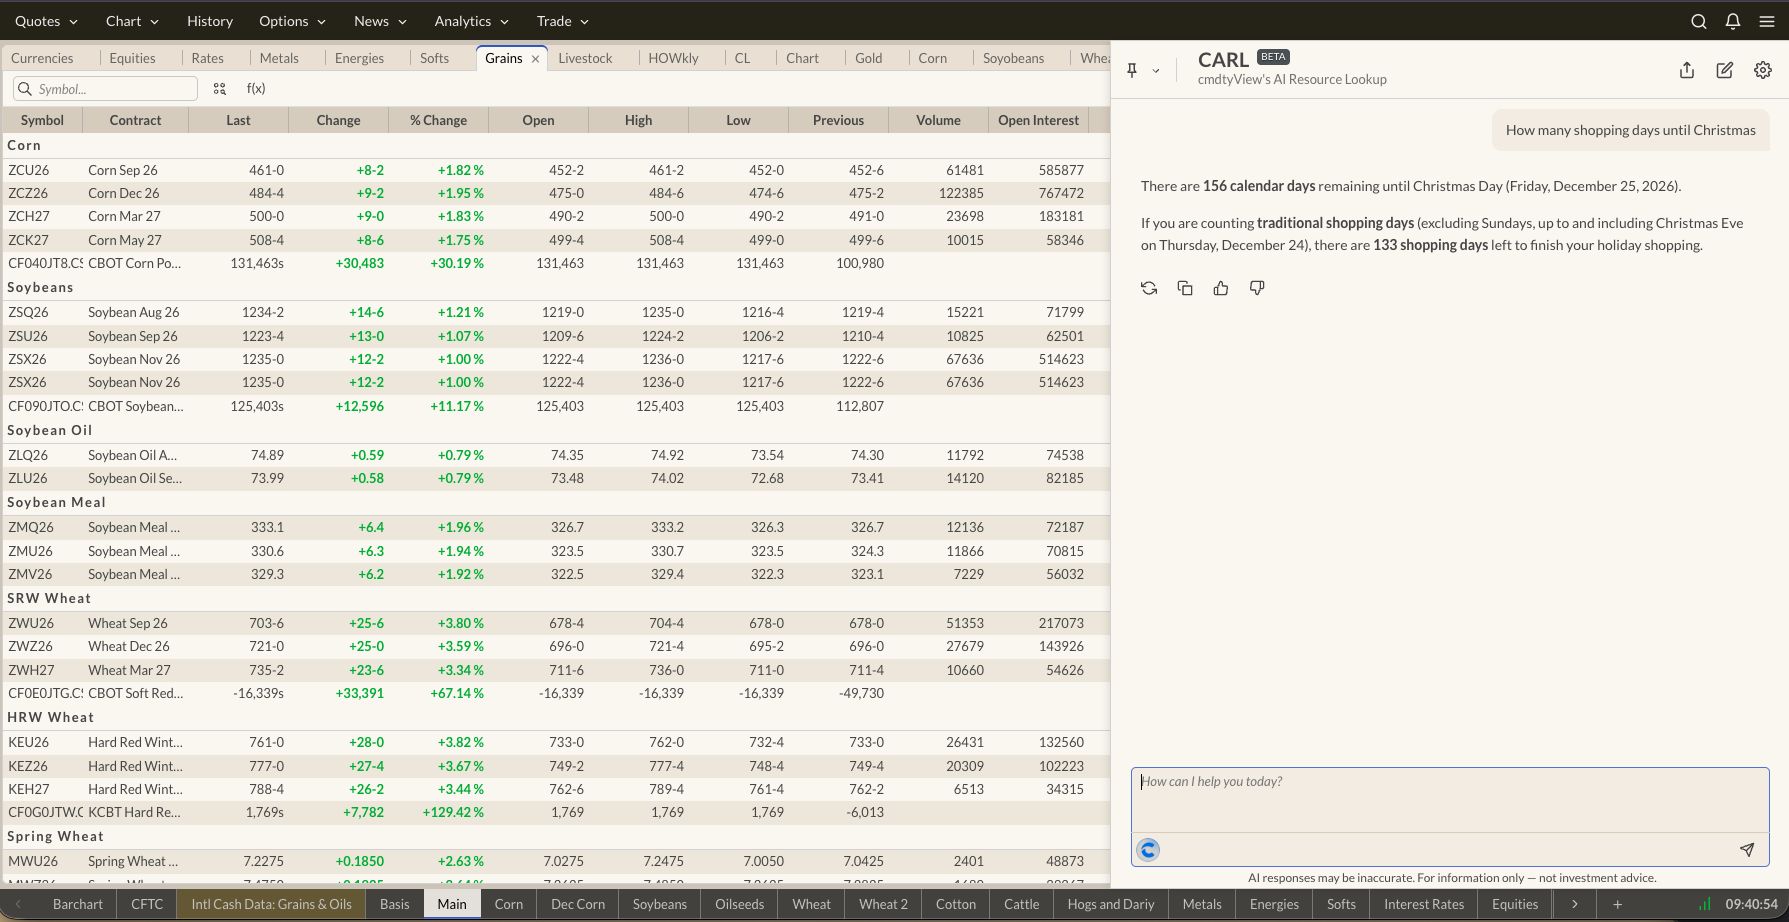
As you might recall, I’ve been visiting with my replacement, Barchart’s AI analyst CARL, frequently this summer[i]. To this point, we’ve generally agreed, first that the world wasn’t going to be running out of wheat anytime soon and second, it's a waste of time making predictions about markets. This morning, with the end of the North American meteorological summer (August 31) growing larger on the horizon, I asked CARL a non-market related question. How many shopping days until Christmas? After thinking for a moment, CARL responded with either 156 calendar days or 133 shopping days. Why am I wondering about this in late July? Because Watson is on a buying spree in the Grains sector[ii], seemingly moving some of the money made the past couple years in Livestock, where both cattle markets are living Tom Petty’s song Free Falling. With this in mind, let’s take a look at some key factors in the three key Grains markets, starting with soybeans.
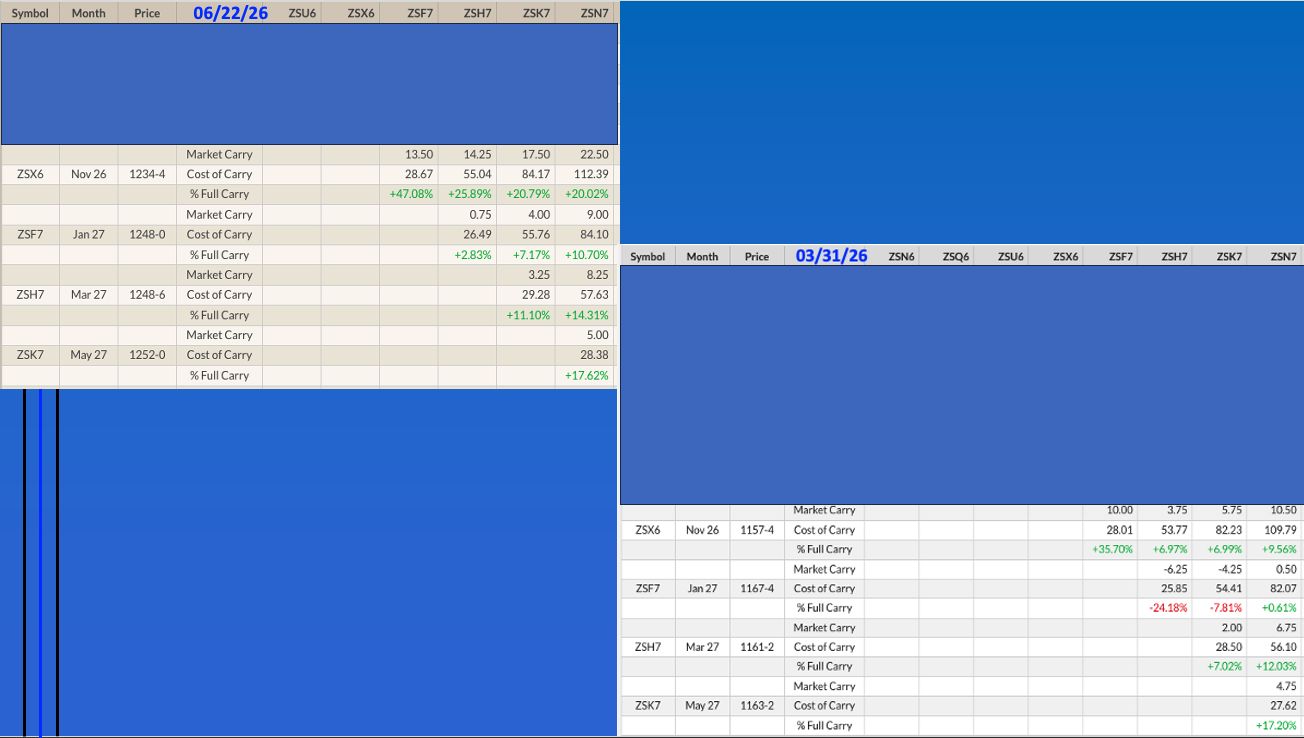
When I started putting this piece together, I was set to discuss how the soybean market’s Cost of Carry table was seeing a Chili Pepper Progression. When a chili pepper matures it changes from green to red. On Barchart’s Cost of Carry tables, when futures spreads move from a carry to an inverse, the numbers also turn from green to red. Given this, when we see one of Barchart’s tables or spread matrices glowing red (e.g. WTI Crude Oil) the market (storable commodity) is showing concern over supplies in relation to demand. However, once I started digging through my collection of month-end soybean Cost of Carry tables, I found the opposite to be true, or in other words a Chili Pepper Regression. What this tells me is that despite all the hullabaloo over “Super El Nino”, since the end of March the carry in the November 2026 (ZSX26) -January 2027 (US 2026 crop) has strengthened, the inverse in the transition Jan-March spread has flipped to a small carry, and the March-May (Brazil 2027 crop) has seen its slight carry firm a bit. However, as the old adage tells us, true or not, “Soybeans are made in August”, so we’ll see what happens.
Don’t Miss a Day: From crude oil to coffee, sign up free for Barchart’s best-in-class commodity analysis.
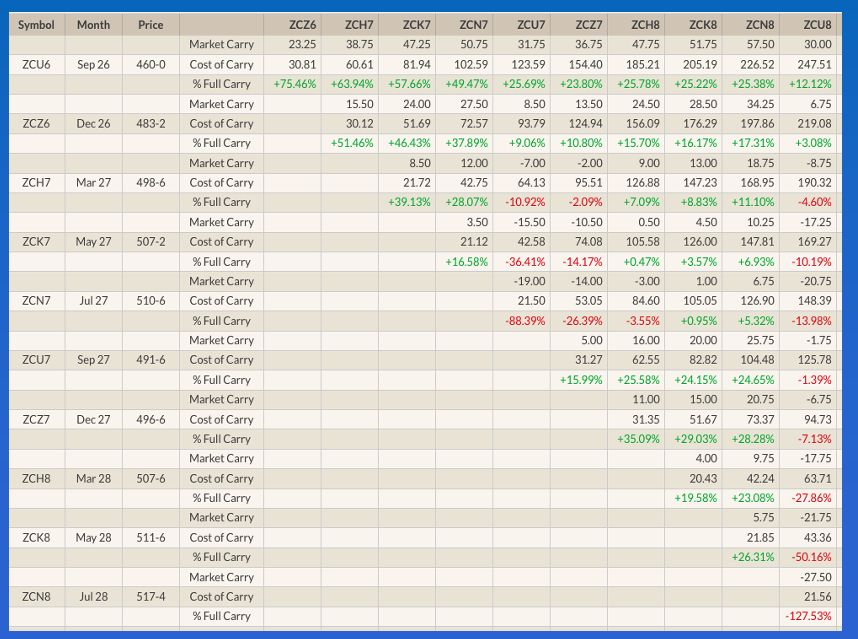
But what about King Corn? Again, futures spreads tell us the real fundamental story, but here it’s a different tale. The September futures contract (ZCU26) is a hybrid, part old-crop and part new-crop. When I work with end-users in the US Southeast, their harvest starts in July and is largely completed by the end of August, meaning production is generally priced against September. On the other hand, much of the rest of the US harvest is just getting under way as the September issue moves into delivery putting the spotlight on December (ZCZ26). Keep this in mind as I talk about the September-December futures spread. (The nearby issue is also affected by leftover supplies moving to town before the next harvest.) Recently, the September-December futures spread has seen its carry strengthen to 23.25 cents and cover a bearish 75.5% calculated full commercial carry. Meanwhile, the December-March was showing a carry of 15.5 cents and covering 51.5%. Over the decades, I’ve noticed a tendency for the deferred spread in a market (e.g. new-crop corn) to follow the track of the previous spread, something I call the Down Escalator Simulator. If this holds true, then fundamentally the corn market shouldn’t support increased fund buying.
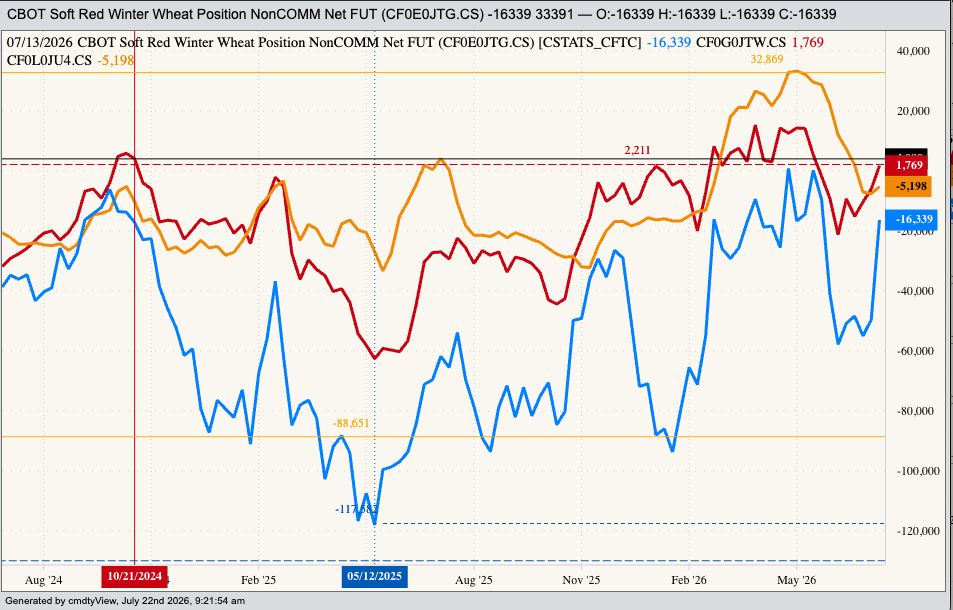
And then there’s wheat, soft red winter (SRW) in particular), known by folks who understand how this market works as Poverty Grass. Why the mean moniker? If you’ve grown it, merchandised it, or traded it, you know the answer. Wheat takes no prisoners, which is what has made the recent move by predictive websites into the commodity complex, wheat (and natural gas) being highlighted, all the more interesting. During my four decades of dealing with the various wheat markets (cash, basis, futures, SRW, HRW, HRS, etc.), I’ve learned a lesson to not be long wheat in December, something I’ve called the Krampus Countdown over the years. A look at the seasonal chart of the SRW National Cash Index shows the 5-year and 10-year indexes don’t necessarily confirm my observation with both trending generally sideways from the last weekly close of November through the first weekly close of January. The trend of the 5-year median weekly close for the basis market (ZWBAUS.CM) is also sideways. It will be interesting to see what happens with this new generation of trader as the noncommercial net-futures position switches from net-short to net-long this week, all while both the September-December and December-March futures spreads remain neutral-to-bearish.
[i] I will be talking about these conversations at Barchart’s Summer Roadshow Series, first in Omaha on August 4 then in Shakopee, Minnesota on August 6. Here is the link for more information on both meetings: (LINK)
[ii] I’ll cover this in more detail with my next piece, after the latest round of Commitments of Traders reports are released.
On the date of publication, Darin Newsom did not have (either directly or indirectly) positions in any of the securities mentioned in this article. All information and data in this article is solely for informational purposes. For more information please view the Barchart Disclosure Policy here.
More news from Barchart
Three Key Factors to Watch in Grains in Late Summer Soybean Meal Prices Keep Heading Higher. How to Trade Them at a 9-Week High. Grain Bulls Are Showing Resilience: What’s Keeping Uptrends in Corn, Soybean, and Wheat Prices Alive Could Lean Hogs Be the Next Big Opportunity?