


Ovintiv Inc. OVV reported second-quarter 2026 adjusted earnings per share of $1.74, which missed the Zacks Consensus Estimate of $1.91 due to decreased year-over-year production volumes, increased expenses and lower average realized natural gas prices. However, the bottom line increased from the year-ago level of $1.02, driven by higher natural gas volumes and higher average realized oil prices.
The Denver, CO-based oil and gas exploration and production company’s total revenues of $3 billion increased 30% from the year-ago quarter’s figures. The top line also beat the Zacks Consensus Estimate by 28.2%. The outperformance was driven by higher product and service revenues.
Ovintiv Inc. Price, Consensus and EPS Surprise
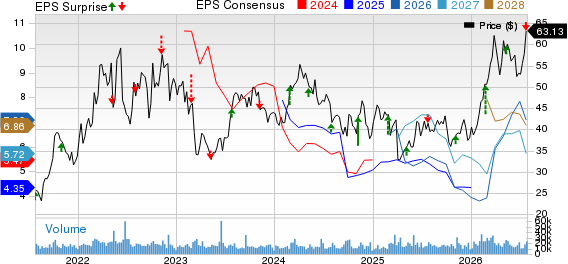
Ovintiv Inc. price-consensus-eps-surprise-chart | Ovintiv Inc. Quote
On July 23, 2026, Ovintiv's board of directors declared a quarterly dividend of 30 cents per share, which will be paid on Sept. 29 to its shareholders of record as of Sept. 15.
First-quarter shareholder returns totaled $429 million, consisting of share buybacks of $345 million and base dividend payments of $84 million.
During the quarter, the company closed the sale of its Anadarko assets for total cash proceeds of about $2.82 billion after preliminary closing adjustments and transaction costs.
OVV’s Q2 Production & Prices
Total second-quarter production was 614,600 barrels of oil equivalent per day (BOE/d) compared with 615,300 BOE/d in the prior-year period. The figure marginally missed our prediction of 615,000 BOE/d.
Natural gas production increased to 1,959 million cubic feet per day (MMcf/d) in the second quarter of 2026 from 1,851 MMcf/d in the prior-year quarter. However, the figure lagged our estimate of 2,001 MMcf/d.
Total liquids production decreased to 288.2 thousand barrels per day (Mbbls/d) in the second quarter of 2026 from 306.7 Mbbls/d in the prior-year quarter. However, the figure beat our prediction of 283 Mbbls/d.
In the second quarter of 2026, natural gas contributed approximately 53.1%, and liquids accounted for about 46.9% of the total production.
Ovintiv's realized natural gas price was $1.99 per thousand cubic feet compared with the year-ago level of $2.38. However, the realized oil price increased substantially to $91.53 per barrel from $65.23 in the prior-year quarter.
OVV’s Costs, Capex & Balance Sheet
Total expenses of $2 billion increased 11.7% from the year-ago quarter’s figure of $1.8 billion. Moreover, the figure was higher than our projection of $1.6 billion.
Ovintiv’s cash from operating activities in the quarter under review was $1.6 billion, compared to the year-ago figure of $1 billion.
OVV's capital investments were $574 million compared with $521 million in the year-ago period. The company generated a non-GAAP free cash flow of $682 million in the reported quarter.
As of June 30, OVV had cash and cash equivalents worth $700 million and long-term debt of $3.7 billion. Its debt-to-capitalization was 24.3%.
OVV’s Asset Performance
In the second quarter of 2026, average production from the Permian Basin reached approximately 231 MBOE/d, with liquids making up 78% of the total. A total of 38 net wells were brought online during the period. For the full year 2026, capital spending in this region is projected to be between $1.325 billion and $1.375 billion, supporting the development of around five rigs and 125-135 net wells.
From the Montney play, second-quarter output averaged 374 MBOE/d, with liquids contributing about 27% of the volume. The company turned in 40 net wells during the quarter. Full-year 2026 capital expenditures for Montney are expected to be between $875 million and $925 million, supporting the development of six rigs and 130-140 net well additions.
OVV’s Q3 & 2026 Guidance
Ovintiv revised its full-year 2026 guidance while issuing third-quarter projections. The company expects full-year production volumes to average between 630 and 645 MBOE/d, including oil and condensate production of 210 to 212 Mbbls/d, NGL production of 83 to 85 Mbbls/d and natural gas production of 2 to 2.1 Bcf/d. Ovintiv’s 2026 capital investment remains unchanged in the range of $2.25 billion to $2.35 billion, reflecting its continued focus on disciplined capital allocation and operational efficiency.
For the third quarter of 2026, this Zacks Rank #3 (Hold) company expects production between 615 and 640 MBOE/d with capital spending of $550 million to $600 million.
You can see the complete list of today’s Zacks #1 Rank (Strong Buy) stocks here.
Important Earnings at a Glance
While we have discussed OVV’s second-quarter results in detail, let us take a look at three other key reports in this space.
Halliburton Company HAL reported second-quarter 2026 adjusted net income per share of 55 cents, marginally beating the Zacks Consensus Estimate of 54 cents. The outperformance was backed by year-over-year revenue growth. However, the bottom line was flat compared with the prior-year level. Meanwhile, the company’s second-quarter revenues of $5.7 billion were up 3.7% year over year and beat the Zacks Consensus Estimate of $5.5 billion. The outperformance was driven by higher revenues in both segments of the company — the Completion and Production segment and the Drilling and Evaluation segment.
Halliburton reported second-quarter capital expenditure of $235 million. As of June 30, 2026, the company had approximately $2 billion in cash/cash equivalents and $7.1 billion in long-term debt, representing a debt-to-capitalization of 39%.
Liberty Energy Inc. LBRT reported a second-quarter 2026 adjusted net profit of 9 cents per share, beating the Zacks Consensus Estimate of 7 cents. The outperformance was driven by the company’s focus on AI-driven technology advancements and strong operational execution. However, the bottom line decreased from the year-ago quarter’s profit of 12 cents due to increased year-over-year costs and expenses. LBRT's revenues totaled $1.2 billion, which beat the Zacks Consensus Estimate of $1.1 billion. The top line also increased from the prior-year quarter’s $1 billion by 14%, supported by record utilization and a modest pricing uplift along with higher product sales.
As of June 30, Liberty Energy had approximately $555.4 million in cash and cash equivalents. The pressure pumper’s long-term debt of $1.3 billion represented a debt-to-capitalization of 39.5%.
Houston, TX-based oil and gas storage and transportation company Kinder Morgan Inc. KMI reported second-quarter 2026 adjusted earnings of 37 cents per share, beating the Zacks Consensus Estimate of 31 cents by 19.35%. Earnings increased 32.1% from 28 cents in the year-ago quarter. Revenues increased 10.8% year over year to $4.48 billion from the prior year’s figure of $4.04 billion. Revenues surpassed the consensus estimate of $4.29 billion by 4.43%.
Cash flow from operations was $1.96 billion in the quarter. Meanwhile, free cash flow was $978 million and free cash flow after dividends reached $313 million. As of June 30, 2026, KMI reported $89 million in cash and cash equivalents. Net debt stood at $32.03 billion at quarter-end.
Zacks' Research Chief Names "Stock Most Likely to Double"
Our team of experts has just released the 5 stocks with the greatest probability of gaining +100% or more in the coming months. Of those 5, Director of Research Sheraz Mian highlights the one stock set to climb highest.
This top pick is a little-known satellite-based communications firm. Space is projected to become a trillion dollar industry, and this company's customer base is growing fast. Analysts have forecasted a major revenue breakout in 2025. Of course, all our elite picks aren't winners but this one could far surpass earlier Zacks' Stocks Set to Double like Hims & Hers Health, which shot up +209%.
Free: See Our Top Stock And 4 Runners UpWant the latest recommendations from Zacks Investment Research? Today, you can download 7 Best Stocks for the Next 30 Days. Click to get this free report
Ovintiv Inc. (OVV): Free Stock Analysis Report
Halliburton Company (HAL): Free Stock Analysis Report
Kinder Morgan, Inc. (KMI): Free Stock Analysis Report
Liberty Energy Inc. (LBRT): Free Stock Analysis Report
This article originally published on Zacks Investment Research (zacks.com).