


Brown & Brown, Inc.’s BRO second-quarter 2026 adjusted earnings of $1.07 per share missed the Zacks Consensus Estimate by 0.9%. The bottom line increased 3.9% year over year.
Revenues of $1.67 billion missed the consensus mark by 2.9% but increased 30.4% year over year. Acquisition activity supported the top line, while organic revenues declined 0.7%.
Brown & Brown, Inc. Price, Consensus and EPS Surprise
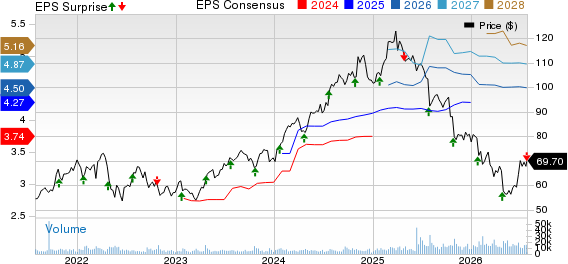
Brown & Brown, Inc. price-consensus-eps-surprise-chart | Brown & Brown, Inc. Quote
BRO's Q2 Details
Commissions and fees rose 32.4% to $1.65 billion, while investment and other income declined to $22 million from $36 million.
Adjusted EBITDAC margin contracted 100 basis points to 35.7%.
Adjusted net income attributable to the company increased 18.4% to $361 million. However, a 14% increase in the diluted weighted-average share count limited per-share growth. GAAP net income rose 24.7% to $288 million, while diluted GAAP earnings increased 7.7% to 84 cents.
Brown & Brown's Organic Growth Slips
Organic revenues decreased 0.7% to $1.18 billion. Organic revenues with contingent commissions increased 0.7% to $1.24 billion, supported by higher profit-sharing commissions from insurance carriers.
Core commissions and fees increased 30.3% year over year to $1.57 billion.
Investment income and other income decreased 39% year over year to $22 million.
BRO's Retail Segment Expands
Retail revenues increased 35.9% year over year to $947 million, primarily due to acquisition activity. Organic revenues advanced 1.5% to $678 million, while organic revenues with contingents increased 2.5% to $692 million.
Net new business and exposure-unit expansion supported organic growth. These gains were partially offset by declines in catastrophe property rates and lower revenues from a specialty pharmacy business. Adjusted EBITDAC climbed 46.9% to $282 million, and the margin expanded 230 basis points to 29.8%.
Brown & Brown's Specialty Unit Softens
Specialty Distribution revenues increased 28.1% to $721 million, aided by acquisitions and higher contingent commissions. Organic revenues, however, declined 3.5% to $498 million, while organic revenues with contingents fell 1.6% to $545 million.
Declining catastrophe property rates and approximately $10 million of new-business timing pressure weighed on the segment. Adjusted EBITDAC rose 17.1% to $308 million, but the adjusted margin contracted 400 basis points to 42.7% amid weaker organic revenues and investments in European capabilities.
BRO's Costs and Margins
Total expenses increased 32.8% year over year to $1.29 billion. Employee compensation and benefits rose 31% to $838 million, while other operating expenses increased 28.4% to $271 million. Amortization more than doubled to $110 million, and interest expense increased 96% to $100 million.
Adjusted EBITDAC rose 27% to $598 million, but growth trailed the top-line increase, resulting in margin contraction. Adjusted income before taxes increased 17.4% to $480 million.
Brown & Brown's Cash Flow and Capital
Net cash provided by operating activities increased 13% to $608 million during the first six months of 2026. Cash and cash equivalents were $918 million as of June 30, down from $1.08 billion at the end of 2025.
The company repurchased $250 million of stock during the second quarter. Brown & Brown also paid $112 million in dividends and declared a quarterly dividend of 16.5 cents per share, up 10% year over year.
BRO's Market Outlook
Management expects rate changes across most admitted insurance lines in the second half of 2026 to remain relatively similar to second-quarter levels. Casualty and auto rates continued to increase, while property and workers’ compensation pricing was flat to lower.
Excess-and-surplus casualty rates are expected to keep rising because of the legal environment. Brown & Brown does not expect catastrophe property rates to change materially in the second half compared with the first. Capital deployment will focus on share repurchases; internal investment, debt reduction and acquisitions centered on specialty businesses.
Zacks Rank
Brown & Brown currently carries a Zacks Rank #3 (Hold). You can see the complete list of today’s Zacks #1 Rank (Strong Buy) stocks here.
Performance of Other Insurers
Selective Insurance Group, Inc. SIGI reported second-quarter 2026 operating earnings of $1.95 per share, which beat the Zacks Consensus Estimate by 13.4%. The bottom line increased 48.9% year over year. Revenues of $1.37 billion rose 4.5% from the year-ago quarter and topped the consensus estimate by 0.7%.
Net premiums written declined 5% year over year to $1.22 billion due to a 6% decrease in Standard Commercial Lines, an 8% fall in Standard Personal Lines, and a 2% decline in Excess and Surplus Lines. Our estimate was $1.33 billion. Net premiums earned increased 2.3%. Direct new business fell to $206.1 million from $248.1 million. Renewal pure price increases averaged 6.5%, down from 9.9% in the prior-year quarter.
Chubb Limited CB reported second-quarter 2026 core operating earnings of $7.26 per share, which beat the Zacks Consensus Estimate of $6.63 by 9.5%. The bottom line increased 18.2% year over year. Revenues rose 2.7% year over year to $15.77 billion but missed the consensus mark of $15.90 billion by 0.8%. Stronger P&C underwriting, record investment income, and higher life insurance income supported results.
Net premiums earned increased 5.8% to $13.89 billion. P&C underwriting income increased 18.8% year over year to $1.94 billion. The combined ratio improved 180 basis points to 83.8%, reflecting a lower share of premiums consumed by claims and expenses. Our estimate was $1.15 billion.
Principal Financial Group, Inc.’s PFG second-quarter 2026 operating earnings of $2.50 per share beat the Zacks Consensus Estimate by 7.3%. The bottom line increased 16% year over year. Revenues rose 6.4% year over year to $3.99 billion, which missed the consensus mark of $4.09 billion by 2.4%.
Total expenses increased 7.6% year over year to $3.41 billion. Benefits, claims and settlement expenses rose 8.3% to $1.99 billion, while operating expenses increased 8.1% to $1.40 billion. Non-GAAP operating earnings climbed 12% to $547 million. Excluding significant variances, operating earnings advanced 13% to $528.7 million, reflecting growth across the operating segments. Net income attributable to PFG declined 1% to $403.4 million.
Beyond Nvidia: AI's Second Wave Is Here
The AI revolution has already minted millionaires. But the stocks everyone knows about aren't likely to keep delivering the biggest profits. AI’s second wave is moving from infrastructure to implementation and these companies are at the forefront of this transition, positioned to become what Amazon and Google were to the internet era.
See Stocks Now >>Want the latest recommendations from Zacks Investment Research? Today, you can download 7 Best Stocks for the Next 30 Days. Click to get this free report
Brown & Brown, Inc. (BRO): Free Stock Analysis Report
Chubb Limited (CB): Free Stock Analysis Report
Principal Financial Group, Inc. (PFG): Free Stock Analysis Report
Selective Insurance Group, Inc. (SIGI): Free Stock Analysis Report
This article originally published on Zacks Investment Research (zacks.com).