


Smurfit Westrock Plc SW has reported second-quarter 2026 adjusted earnings of 35 cents per share, down 20% year over year. The figure missed the Zacks Consensus Estimate of 42 cents by 16.7%. Higher input costs, particularly freight, pressured profitability.
Net sales increased 1.1% year over year to $8.03 billion and surpassed the consensus estimate of $7.99 billion by 0.5%.
Smurfit Westrock PLC Price, Consensus and EPS Surprise
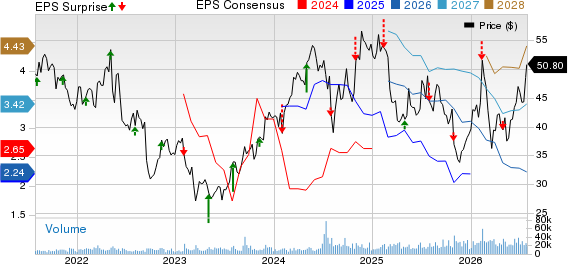
Smurfit Westrock PLC price-consensus-eps-surprise-chart | Smurfit Westrock PLC Quote
SW’s Gross Profit Falls in Q2
Smurfit Westrock has reported an operating profit of $309 million, up 23.1% year over year. The company’s cost of sales increased 3.2% to $6.63 billion from the year-ago period. Gross profit fell 7.7% year over year to $1.40 billion.
Adjusted EBITDA declined to $1.14 billion from $1.21 billion a year ago, while the adjusted EBITDA margin contracted to 14.2% from 15.3%.
SW’s Q2 Segmental Performance
In North America, net sales totaled $4.74 billion, moving down marginally from $4.76 billion in the year-ago quarter. Adjusted EBITDA declined 6.4% year over year to $704 million. Corrugated volumes fell 4.8% on a days-adjusted basis, reflecting continued pressure in the region. However, SW noted improving commercial momentum, a supportive pricing backdrop and progress in cost-reduction initiatives.
The Europe, MEA & APAC segment delivered net sales of $2.83 billion, up 1.7% from $2.78 billion in the prior-year quarter. The segment’s adjusted EBITDA increased 2.2% year over year to $380 million. Corrugated volumes rose 1.5% on a days-adjusted basis, supported by strengthening containerboard markets, improving corrugated pricing and disciplined cost management.
Net sales of the LATAM segment were $559 million, up 7.9% year over year from $518 million. Adjusted EBITDA came in at $124 million compared with $123 million in the second quarter of 2025. Corrugated volumes increased 1% on a days-adjusted basis, aided by healthy demand across the key markets and pricing actions that helped offset inflationary pressures.
Smurfit Westrock’s Cash Position & Balance Sheet Updates
SW had cash and cash equivalents of $677 million as of June 30, 2026, compared with $892 million at the end of 2025. Net cash provided by operating activities was $765 million compared with $829 million in the year-ago quarter. Capital expenditure totaled $465 million, down from $522 million in the prior-year period.
The company announced a quarterly dividend of 45.23 cents per ordinary share, payable Sept. 10, 2026, to shareholders of record as of Aug. 14.
SW’s 2026 EBITDA Outlook
For the third quarter of 2026, the company expects adjusted EBITDA of $1.3 billion. Full-year adjusted EBITDA is projected between $4.9 billion and $5.1 billion, with momentum through the second half of 2026.
The company expects 2026 freight and energy cost increases of $300 million and $220 million, respectively. Third-quarter year-over-year increases are projected at $80 million for freight and $70 million for energy.
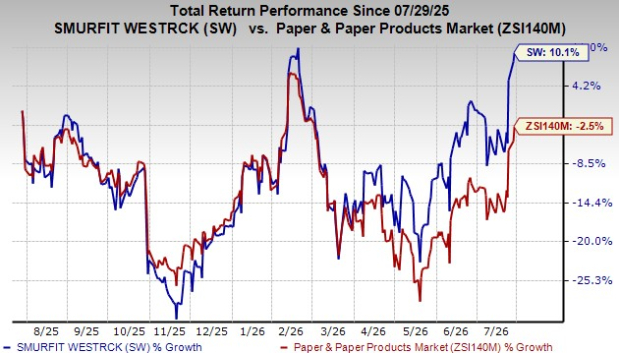
Smurfit Westrock Stock’s Price Performance
Shares of the company have gained 10.1% in the past year against the industry’s 2.5% decline.
Smurfit Westrock’s Zacks Rank
The company currently has a Zacks Rank #3 (Hold). You can see the complete list of today’s Zacks #1 Rank (Strong Buy) stocks here.
SW’s Peer Performance
Packaging Corporation of America PKG reported second-quarter 2026 adjusted earnings of $2.35 per share, falling 5.2% year over year but beating the Zacks Consensus Estimate of $2.31.
Packaging Corp’s sales increased 14.7% year over year to $2.49 billion and surpassed the consensus estimate of $2.40 billion by 3.6%. Total corrugated products shipments reached an all-time quarterly record, rising 24.3% both per day and in total from the prior-year quarter.
Paper & Related Product Stocks Awaiting Results
International Paper Company IP is expected to release second-quarter 2026 results on July 30. The Zacks Consensus Estimate for the bottom line is pegged at a loss of 4 cents per share. The company posted earnings of 20 cents per share in the year-ago quarter.
The consensus estimate for International Paper’s top line is pegged at $6.17 billion, indicating an 8.8% decline from the prior-year reported figure.
Rayonier Advanced Materials RYAM is expected to release second-quarter 2026 results on Aug. 4. The Zacks Consensus Estimate for the bottom line is pegged at a loss of 17 cents per share. The company incurred a loss of 43 cents per share in the year-ago quarter.
The consensus estimate for Rayonier Advanced Materials’ top line is pegged at $357.5 million, indicating 5.5% growth from the prior-year reported figure.
Zacks' Research Chief Names "Stock Most Likely to Double"
Our team of experts has just released the 5 stocks with the greatest probability of gaining +100% or more in the coming months. Of those 5, Director of Research Sheraz Mian highlights the one stock set to climb highest.
This top pick is a little-known satellite-based communications firm. Space is projected to become a trillion dollar industry, and this company's customer base is growing fast. Analysts have forecasted a major revenue breakout in 2025. Of course, all our elite picks aren't winners but this one could far surpass earlier Zacks' Stocks Set to Double like Hims & Hers Health, which shot up +209%.
Free: See Our Top Stock And 4 Runners UpWant the latest recommendations from Zacks Investment Research? Today, you can download 7 Best Stocks for the Next 30 Days. Click to get this free report
Smurfit Westrock PLC (SW): Free Stock Analysis Report
International Paper Company (IP): Free Stock Analysis Report
Packaging Corporation of America (PKG): Free Stock Analysis Report
Rayonier Advanced Materials Inc. (RYAM): Free Stock Analysis Report
This article originally published on Zacks Investment Research (zacks.com).