

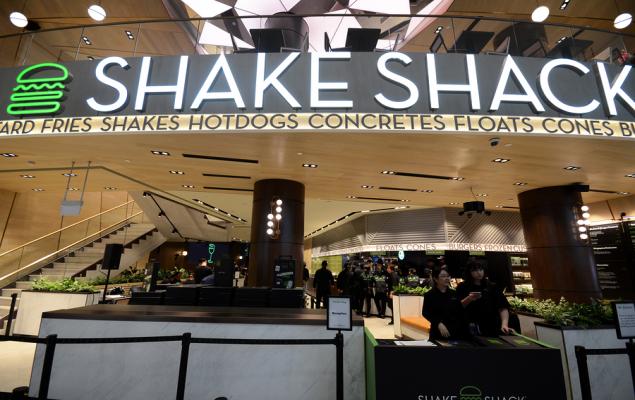
Shake Shack Inc. SHAK reported second-quarter fiscal 2026 results, with earnings beating the Zacks Consensus Estimate and revenues missing the same. The top line increased year over year, while adjusted earnings declined.
The company reported solid demand, with same-Shack sales increasing 3.5% and traffic rising 2%. New Shack openings supported double-digit revenue growth, but record-high beef costs and higher operating expenses weighed on restaurant-level margins.
SHAK’s Q2 Earnings & Revenues
For the fiscal second quarter, the company reported adjusted earnings of 43 cents per share, beating the Zacks Consensus Estimate of 31 cents by 38.71%. Adjusted earnings declined 2.3% from 44 cents per share in the prior-year quarter.
Shake Shack, Inc. Price, Consensus and EPS Surprise
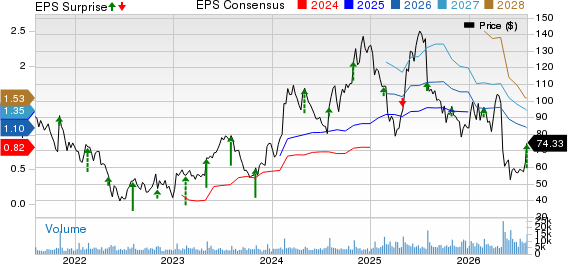
Shake Shack, Inc. price-consensus-eps-surprise-chart | Shake Shack, Inc. Quote
Quarterly revenues of $417.6 million missed the consensus mark of $418 million by 0.04%. The top line increased 17.2% from $356.5 million reported in the year-ago quarter.
Shake Shack’s Q2 Sales and Traffic
In the fiscal second quarter, Shack sales increased 17.5% year over year to $403.4 million from $343.2 million. Our estimate for the metric was 412 million.
Licensing revenues rose 7.1% to $14.2 million from $13.2 million. Our estimate for the metric was 13.7 million.
System-wide sales advanced 13.8% to $625.8 million. Average weekly sales were approximately $78,000, unchanged from the prior-year quarter.
Management estimated that the World Cup contributed approximately 90 basis points to comparable sales. In-Shack menu pricing increased 3.7%, while blended pricing across all channels rose 4.4%. Comparable app channel sales grew nearly 30% year over year, and digital sales represented almost 41% of Shack sales.
SHAK’s Q2 Restaurant-Level Performance
In the fiscal second quarter, restaurant-level profit increased 12.8% year over year to $92.7 million from approximately $82.2 million. However, restaurant-level profit margin contracted 90 basis points to 23% of Shack sales from 23.9%.
Food and paper costs increased 20.3% year over year to $116.3 million from $96.6 million. As a percentage of Shack sales, these expenses rose 60 basis points year over year to 28.8%, reflecting higher commodity costs, promotional activity and a shift toward higher-cost menu items.
Beef, which represents approximately 35% of the food and paper basket, experienced mid-teens inflation. Total blended food and paper inflation was in the low-single-digit range during the quarter. Labor and related expenses increased 15% year over year to $101.2 million.
Shake Shack’s Q2 Operating Costs and Profitability
Other operating expenses in the fiscal second quarter increased 24.3% year over year to $63.1 million and rose 80 basis points year over year to 15.6% of Shack sales. The increase primarily reflected higher delivery commissions. Occupancy expenses increased 17.8% year over year to $30.2 million.
Operating income declined 7.3% year over year to $20.7 million. Our estimate for the metric was $23.9 million.
Net income attributable to Shake Shack decreased 8.6% year over year to $15.7 million. Our estimate for the metric was $17.5 million.
Adjusted EBITDA increased 3.9% year over year to $61.2 million from $58.9 million reported in the year-ago quarter. However, the adjusted EBITDA margin contracted 180 basis points year over year to 14.7%.
General and administrative expenses rose 18.8% year over year to $48.3 million. Depreciation and amortization increased 15.7% year over year to $30.7 million, while preopening costs climbed 34% to $6.6 million.
SHAK’s Development and Licensed Business
Shake Shack opened 16 company-operated Shacks during the quarter, up 23.1% from 13 openings in the prior-year period. This marked the company’s strongest second-quarter development performance on record and brought year-to-date company-operated openings to 33.
The company opened 11 licensed Shacks, up 22.2% from nine a year earlier, and closed three locations. This resulted in eight net licensed additions.
The system-wide Shack count increased 15.2% year over year to 703 from 610. Licensing sales rose 7.6% to $222.4 million from $206.7 million, supported by U.S. airports, Canada, the United Kingdom and parts of China.
Continued conflict in the Middle East pressured the United Arab Emirates, historically Shake Shack’s highest-volume market in the region. The company maintained its target of 60-65 company-operated openings and 40-45 licensed openings in fiscal 2026.
Shake Shack’s Cash Position and ’26 Outlook
Shake Shack ended the quarter with $308 million in cash and cash equivalents, down 8.6% from $336.8 million a year earlier. Net cash provided by operating activities for the first half declined 32% year over year to $65.5 million.
Management maintained its full-year outlook but expects adjusted EBITDA and net income to finish at the low end of their respective guidance ranges. Beef inflation, tougher comparisons and competitive intensity are expected to remain headwinds in the second half.
For 2026, Shake Shack expects total revenues of $1.6 billion to $1.7 billion and licensing revenues of $57 million to $59 million. Same-Shack sales are projected to increase in the low-single-digit percentage range from 2025.
The company expects a restaurant-level profit margin of 22% to 23%. General and administrative expenses are projected at 12% to 13% of total revenues. Depreciation and amortization expenses are forecast between $124 million and $128 million. Preopening costs are expected in the range of $26 million to $28 million.
Shake Shack projects net income of $45 million to $55 million and adjusted EBITDA of $225 million to $235 million. Management expects both measures to finish at the low end of their respective guidance ranges. The adjusted pro forma tax rate is projected between 25% and 27%.
SHAK’s Zacks Rank
Shake Shack currently has a Zacks Rank #3 (Hold).
Stocks to Consider
Here are some better-ranked stocks from the Zacks Retail-Wholesale sector:
BJ's Restaurants, Inc. BJRI currently sports a Zacks Rank #1 (Strong Buy). The company delivered a trailing four-quarter earnings surprise of 127.9%, on average. BJRI stock has risen 54.9% in the past six months. You can see the complete list of today’s Zacks #1 Rank stocks here.
The Zacks Consensus Estimate for BJ's Restaurants’ 2026 sales and EPS indicates year-over-year growth of 4% each, respectively.
Five Below, Inc. FIVE presently carries a Zacks Rank #2 (Buy). The company delivered a trailing four-quarter earnings surprise of 70.1%, on average. FIVE stock has gained 7% in the past six months.
The Zacks Consensus Estimate for Five Below’s 2027 sales and EPS indicates growth of 23.9% and 36.1%, respectively, from the year-ago period’s levels.
FIGS, Inc. FIGS has a Zacks Rank #2 at present. The company delivered a trailing four-quarter earnings surprise of 212.5%, on average. FIGS stock has inched up 1.7% in the past six months.
The Zacks Consensus Estimate for FIGS’ 2026 sales and EPS indicates growth of 15.5% and 36.8%, respectively, from the prior-year levels.
7 Best Stocks for the Next 30 Days
Just released: Experts distill 7 elite stocks from the current list of 220 Zacks Rank #1 Strong Buys. They deem these tickers "Most Likely for Early Price Pops."
Since 1988, the full list has beaten the market more than 2X over with an average gain of +23.9% per year. So be sure to give these hand picked 7 your immediate attention.
See them now >>Want the latest recommendations from Zacks Investment Research? Today, you can download 7 Best Stocks for the Next 30 Days. Click to get this free report
Shake Shack, Inc. (SHAK): Free Stock Analysis Report
BJ's Restaurants, Inc. (BJRI): Free Stock Analysis Report
Five Below, Inc. (FIVE): Free Stock Analysis Report
FIGS, Inc. (FIGS): Free Stock Analysis Report
This article originally published on Zacks Investment Research (zacks.com).