

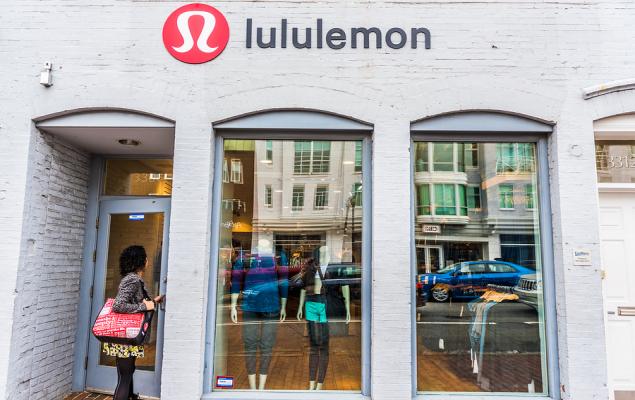
lululemon athletica inc. LULU reported second-quarter fiscal 2026 results, with earnings per share (EPS) surpassing the Zacks Consensus Estimate while revenues fell short. The company delivered top- and bottom-line declines year-over-year. Results benefited from tariff refunds, though demand remained pressured by weaker comparable sales.
lululemon’s fiscal second-quarter adjusted EPS of $2.06 declined 33.5% year over year but surpassed the Zacks Consensus Estimate of $1.79 by 15.1%.
The Vancouver, Canada-based company’s quarterly revenues declined 4% from the year-ago period to $2.42 billion and 5% on a constant-dollar basis. Revenues missed the Zacks Consensus Estimate of $2.47 billion by 2.1%. The decline was primarily driven by weaker Americas revenues, partially offset by growth in the China Mainland and Rest of World markets.
lululemon athletica inc. Price, Consensus and EPS Surprise
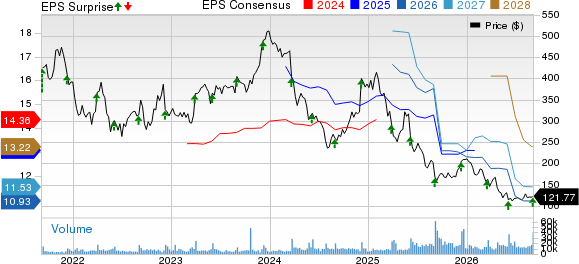
lululemon athletica inc. price-consensus-eps-surprise-chart | lululemon athletica inc. Quote
Comparable sales (comps) declined 9% year over year and 10% on a constant-dollar basis, highlighting softer demand trends across key markets. The company also saw mixed category performance, with apparel trends holding up better than accessories. The Americas remained the largest challenge, while international markets provided some support. Our model predicted a comps decline of 4.5% for the fiscal second quarter.
Comps in the Americas declined 12% on a reported basis. Internationally, comps decreased 3% on a reported basis and 6% on a constant-dollar basis.
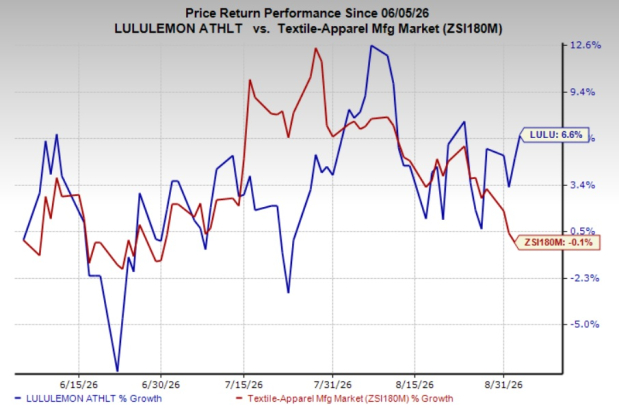
The Zacks Rank #3 (Hold) company has risen 6.6% in the past three months against the Textile - Apparel industry’s 0.1% decline.
Image Source: Zacks Investment Research
LULU's Sales Trends Reflect Regional Pressure
Americas revenues declined 8% year over year to $1.6 billion and represented 67% of the total revenues compared with 70% in the prior-year quarter. In the United States, revenues declined 8%, while in Canada, revenues decreased 11% on a reported basis and 9% on a constant-currency basis.
International revenues rose 4% y/y (2% on a constant-dollar basis). In the fiscal second quarter, China Mainland revenues grew 4% on a reported basis to $407.1 million, while declining 2% on a constant-currency basis, reflecting the impacts of foreign exchange headwinds. Meanwhile, the Rest of the World segment, which comprises EMEA and APAC, delivered a solid performance, with revenues increasing 5% to $391.8 million on a reported basis and 6% on a constant-currency basis.
Comps in Mainland China were down 2% (8% in constant dollars), and Rest of World were down 4% (3% in constant dollars).
LULU’s store network continued expanding despite softer demand. The company opened nine net new company-operated stores in the quarter, ending with 825 locations compared with 784 stores at the end of the prior-year quarter.
Digital trends remained under pressure, with digital revenues declining 6%. Store revenues also declined 6%, reflecting weaker traffic and conversion trends across channels.
lululemon’s Product Mix Shows Uneven Demand
lululemon saw mixed performance across categories in the quarter. Women’s apparel revenues declined 4% year over year, men’s apparel revenues decreased 1%, and accessories and other revenues dropped 13%.
Management highlighted stronger performance in select newer styles while noting that some product launches did not meet expectations. The company is adjusting inventory flows and increasing focus on products showing stronger customer response.
The company is also working to improve brand engagement through marketing investments and community initiatives. Management noted that product innovation, brand activation and guest experience remain key focus areas.
lululemon increased its product chase activity, allowing it to reorder stronger-performing styles more quickly while reducing exposure to weaker products.
LULU’s Margins Gain From Tariff Benefits
LULU’s profitability benefited from tariff refunds in the quarter. Gross profit totaled $1.5 billion, while the gross margin increased 200 basis points (bps) year over year to 60.5%. The improvement included a $134.5-million tariff refund that increased the gross margin by 560 bps. We expected the gross margin to expand 410 bps year over year to 45.6% for the fiscal second quarter.
However, higher tariffs, markdowns and fixed-cost pressures continued to weigh on profitability. Fixed costs increased as a percentage of revenues due to occupancy, depreciation and investments across the store network.
Selling, general and administrative (SG&A) expenses rose to $1 billion. SG&A expenses, as a percentage of net revenues, were 41.7%, up 400 bps from 37.7% in the year-ago quarter. The increase reflected fixed-cost deleverage, guest experience investments, marketing spending and proxy contest-related fees.
Our model predicted SG&A expenses to rise 10.7% year over year for the fiscal second quarter, with a 500-bps increase in the SG&A expense rate to 42.7%.
Operating income declined 13% to $453.7 million and the operating margin decreased 190 bps to 18.8% from 20.7% in the prior-year quarter.
Our model predicted a 45.3% year-over-year decline in adjusted operating income to $286.6 million. We estimated the operating margin to decline 910 bps to 11.6%.
LULU Maintains Financial Flexibility
lululemon ended the quarter with $1.4 billion in cash and cash equivalents and $593.7 million of available capacity under its revolving credit facility. Inventory totaled $1.7 billion, down 1% year over year, while unit inventory declined 7%.
The company generated $589.3 million in operating cash flow in the first two quarters of fiscal 2026 compared with $209.7 million in the prior-year period.
LULU repurchased 2.7 million shares in the quarter for $330 million. Capital expenditure totaled $149.7 million, focused on distribution center investments, store projects, relocations, renovations and technology initiatives.
The company continues balancing investments in long-term growth initiatives with efforts to improve near-term operating efficiency.
lululemon's Outlook Reflects Softer Demand
LULU lowered its fiscal 2026 outlook as it navigates slower sales trends. The company expects full-year revenues of $10.35-$10.50 billion, indicating a decline of 5-7%. Earnings per share are expected to be $9.48 to $9.73.
For the third quarter of fiscal 2026, revenues are expected between $2.29 billion and $2.32 billion, suggesting a decline of 10-11%. Earnings per share are projected at 93-98 cents.
Management cited weaker brand sentiment, softer product launch responses and traffic pressure as factors influencing the revised outlook. The company plans to increase marketing investments while maintaining tighter expense controls.
lululemon also expects 35 net new company-operated store openings in fiscal 2026, below its previous plan, while continuing to invest in strategic locations and market expansion.
Solid Picks in LULU’s Broader Industry
We have highlighted three better-ranked stocks from the same industry, namely Kontoor Brands Inc. KTB, Savers Value Village, Inc. SVV and Wolverine World Wide Inc. WWW.
Kontoor Brands is a lifestyle apparel company that designs, manufactures, procures, sells and licenses apparel, footwear and accessories. KTB has a Zacks Rank #2 (Buy) at present. You can see the complete list of today’s Zacks #1 Rank (Strong Buy) stocks here.
The Zacks Consensus Estimate for Kontoor Brands’ 2026 sales and EPS indicates declines of 14.3% and 6.1%, respectively, from the year-ago period’s reported figures. Kontoor Brands has a trailing four-quarter earnings surprise of 21.4%, on average.
Savers Value Village sells second-hand merchandise in retail stores principally in the United States, Canada and Australia. SVV has a Zacks Rank #2 at present.
The Zacks Consensus Estimate for Savers Value Village’s 2026 sales and earnings indicates growth of 6.1% and 6.7%, respectively, from the year-ago period’s reported figures. SVV has a trailing four-quarter negative earnings surprise of 1.6%, on average.
Wolverine World Wide designs, manufactures and distributes a wide variety of casual and active footwear and apparel. WWW currently carries a Zacks Rank #2.
The Zacks Consensus Estimate for Wolverine World Wide’s 2026 sales and earnings indicates growth of 6.6% and 22.4%, respectively, from the year-ago period’s reported figures. WWW has a trailing four-quarter earnings surprise of 7.6%, on average.
Research Chief Names "Single Best Pick to Double"
From thousands of stocks, 5 Zacks experts each have chosen their favorite to skyrocket +100% or more in months to come. From those 5, Director of Research Sheraz Mian hand-picks one to have the most explosive upside of all.
This company targets millennial and Gen Z audiences, generating nearly $1 billion in revenue last quarter alone. A recent pullback makes now an ideal time to jump aboard. Of course, all our elite picks aren’t winners but this one could far surpass earlier Zacks’ Stocks Set to Double like Nano-X Imaging which shot up +129.6% in little more than 9 months.
Free: See Our Top Stock And 4 Runners UpWant the latest recommendations from Zacks Investment Research? Today, you can download 7 Best Stocks for the Next 30 Days. Click to get this free report
lululemon athletica inc. (LULU): Free Stock Analysis Report
Wolverine World Wide, Inc. (WWW): Free Stock Analysis Report
Kontoor Brands, Inc. (KTB): Free Stock Analysis Report
Savers Value Village, Inc. (SVV): Free Stock Analysis Report
This article originally published on Zacks Investment Research (zacks.com).