
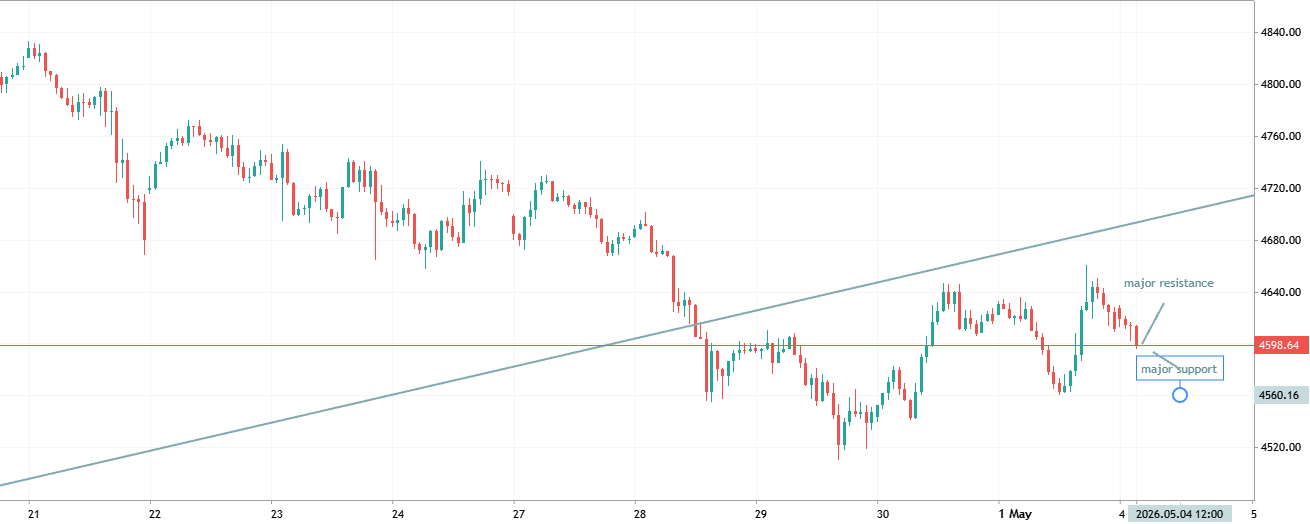
The chart shows a significant shift in market sentiment over the last few trading sessions:
Bearish Breakout: After a period of consolidation between April 23rd and 28th, the price experienced a sharp breakdown below the previous support level (indicated by the horizontal red line around 4613.00).
Trendline Interaction: There is a long-term ascending trendline (the blue diagonal line). The price has recently broken below this trendline, retested it from underneath, and failed to reclaim it, which is a classic technical signal for a trend reversal or a deeper correction.
Current Momentum: The price is currently trading near 4603.38. After hitting a recent swing low near 4595, the market is seeing a minor corrective bounce, but the overall immediate structure remains bearish as long as it stays below the 4615 area.
Nuevo comentario