
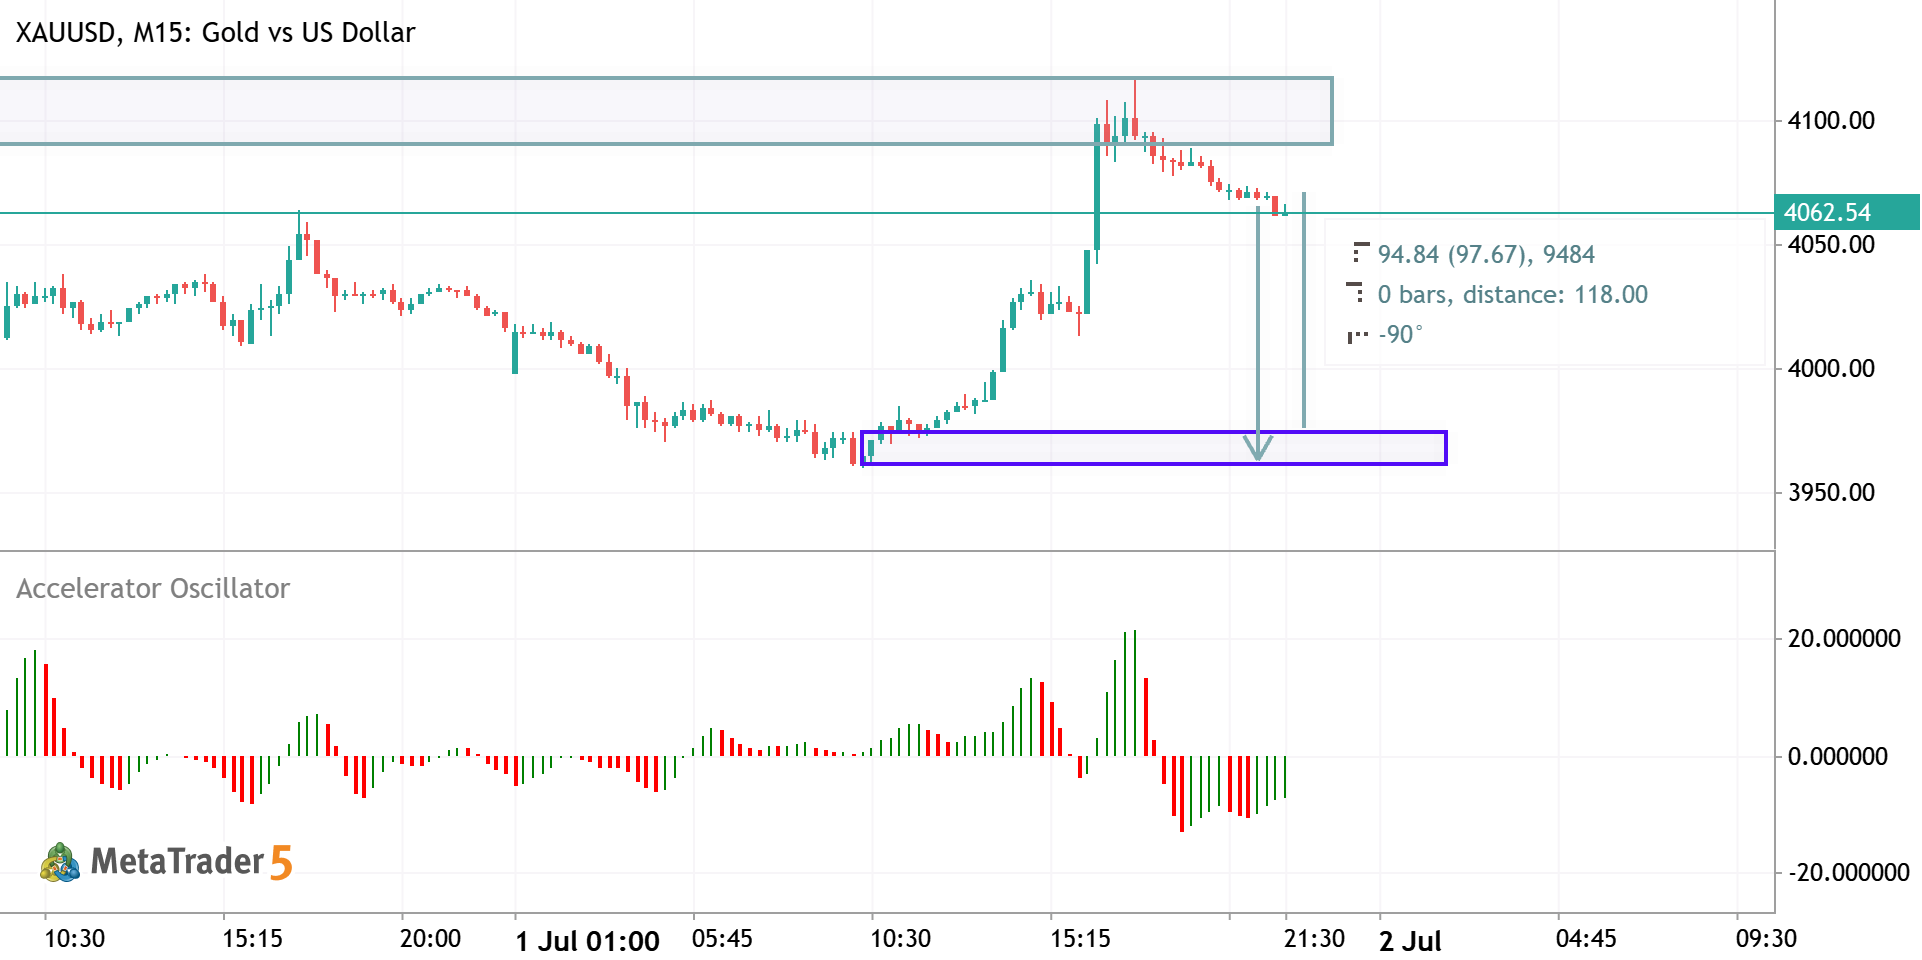
From the chart, the market structure is still bullish overall, but the short-term momentum is weakening after a strong impulsive rally.
Market Structure
- Gold made a strong bullish breakout, pushing price from around 3965 to above 4090, confirming aggressive buying.
- After reaching the highs near 4105–4110, price has entered a pullback/consolidation phase.
- The current candles show lower highs, indicating that buyers are taking profits and sellers are gaining some short-term control.
Key Levels
- Resistance: 4088–4110 (highlighted supply zone)
- This is where sellers stepped in after the breakout.
- Current Price: Around 4065
- Major Support: 3960–3970 (blue demand zone)
- This is the last strong accumulation area before the rally.
- It is also the area where buyers are most likely to defend the trend.
Momentum
- The Accelerator Oscillator is mostly below zero with several red bars.
- This suggests bearish momentum is increasing in the short term, supporting the current pullback.
Price Expectation
The chart suggests two possible scenarios:
- Higher Probability (based on your markings)
- Price continues correcting lower.
- A move toward the 3960–3970 demand zone is possible before buyers return.
- This would be approximately a 95-point decline from the current level.
- Alternative Scenario
- If buyers defend above 4045–4050, price may resume its uptrend and attempt another test of 4090–4110.
Overall Bias
- Short-term: Bearish (correction in progress)
- Medium-term: Bullish (overall trend remains intact unless the demand zone fails)
Trading Outlook
- Selling into the current correction has a reasonable probability while price remains below 4080–4090.
- The 3960–3970 zone is the most important area to watch for either:
- a bullish reversal, or
- a breakdown that could signal a deeper bearish move.
Overall assessment: The chart favours a pullback toward the 3960–3970 demand zone, after which the market's reaction will determine whether the broader bullish trend continues or reverses.

 Perfil en MQL5
Nuevo comentario