
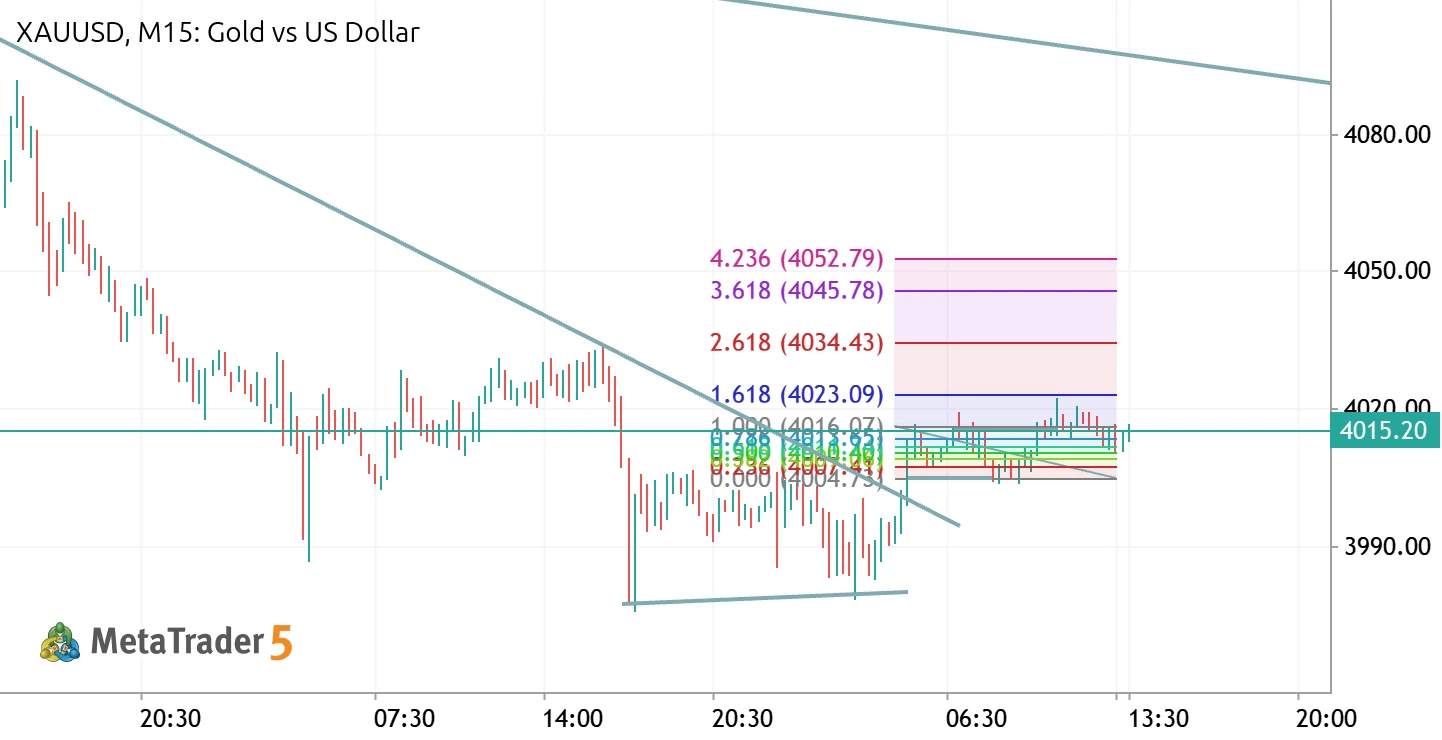
Price Structure & Trend Analysis:
- Major Trend: Overall, the price movement is still within a downtrend, indicated by the primary descending trendline (the upper diagonal line) acting as dynamic resistance.
- Short-Term Momentum: At the lower area, the price formed a consolidation pattern and has just broken out of the minor descending trendline. This breakout provides an early signal of a potential upward correction or short-term reversal.
Key Levels & Fibonacci Areas:
- Critical Resistance Area: Currently, the price (at 4015.13) is testing a highly crucial resistance area. This zone is a confluence between the horizontal support/resistance line and the 1.000 Fibonacci level at 4015.67.
- Upside Projection Targets: Based on the Fibonacci drawing on the chart, if the price successfully breaks above the 4015.67 resistance, there are several upside targets:
- Target 1: Level 1.618 at 4022.56
- Target 2: Level 2.618 at 4033.72
- Target 3: Level 3.618 at 4044.88
- Target 4: Level 4.236 at 4051.78
Price Movement Scenarios:
- Bullish Scenario: If there is a solid candle close above the 4015.67 level, the price has the potential to move higher towards the nearest Fibonacci targets at 4022.56 to 4033.72.
- Bearish Scenario: Conversely, if the price experiences a strong rejection at the 4015.67 resistance area, the previous minor breakout could be considered a false breakout, and the price will likely face downward pressure following the main trend.
 Perfil en MQL5
Nuevo comentario