

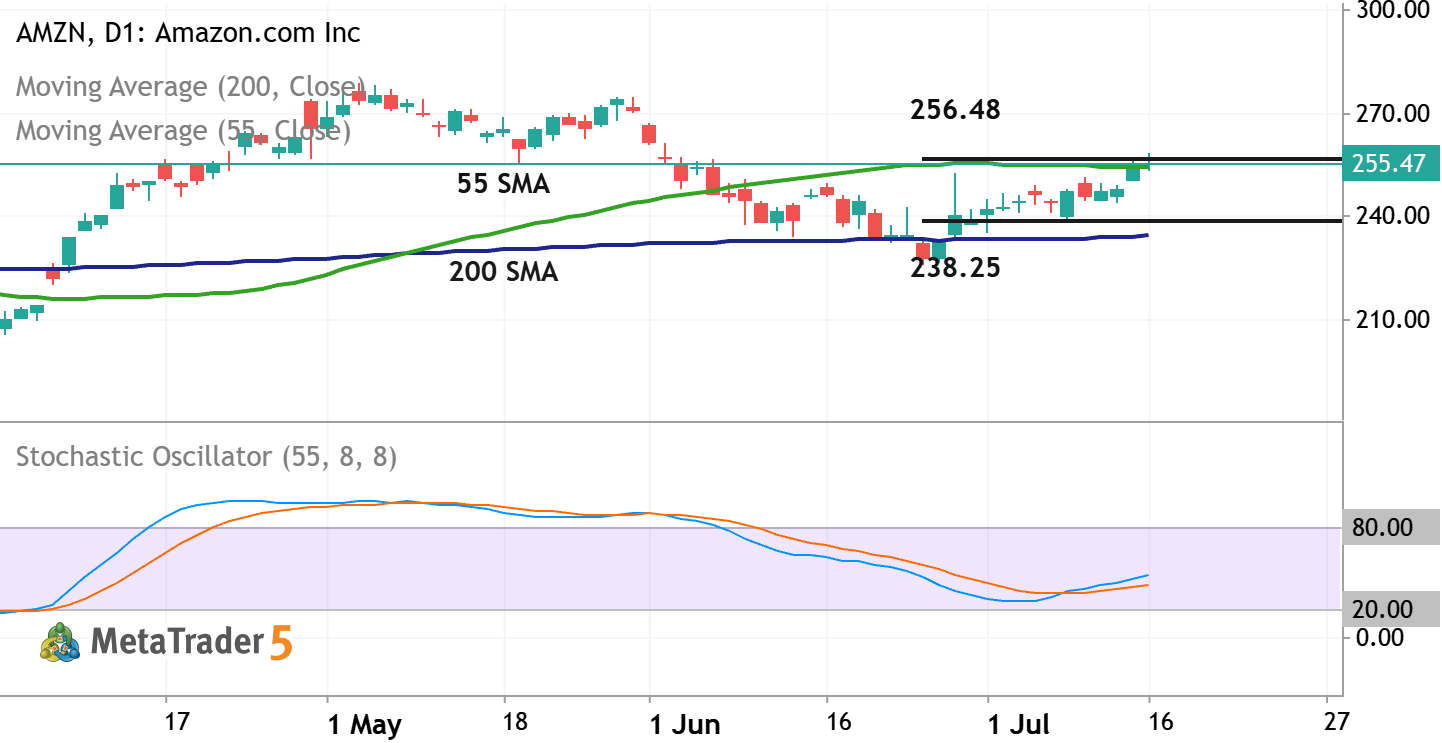
Daily price is located above 200 SMA in the bullish area of the chart. The Stochastic oscillator is showing the uptrend to be started by crossing the 50 level to above, and the price is trying to break the resistance level at 256.48 together with 55 SMA to above for the strong bullish trend to be continuing.
- If the price breaks resistance at 256.48 together with 55 SMA to above so the primary bullish market condition will be continuing for daily price.
- If the price crosses support level at 238.25 together with 200 SMA to below so the primary bearish reversal will be started.
- Alternatively, the price will be on secondary ranging above 200 SMA to be inside s/r levels waiting for direction of the strong trend tioo be started.
Trading Summary: bullish ranging for direction.

 Perfil en MQL5
Nuevo comentario