


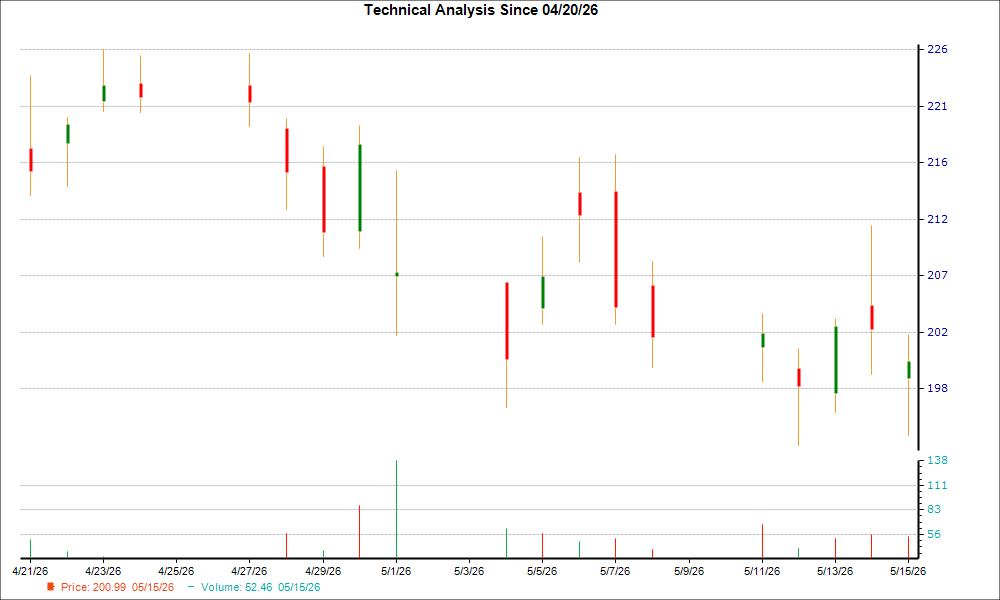
The price trend for SPX Technologies (SPXC) has been bearish lately and the stock has lost 5.8% over the past two weeks. However, the formation of a hammer chart pattern in its last trading session indicates that the stock could witness a trend reversal soon, as bulls might have gained significant control over the price to help it find support.
While the formation of a hammer pattern is a technical indication of nearing a bottom with potential exhaustion of selling pressure, rising optimism among Wall Street analysts about the future earnings of this infrastructure equipment supplier is a solid fundamental factor that enhances the prospects of a trend reversal for the stock.
Understanding Hammer Chart and the Technique to Trade It
This is one of the popular price patterns in candlestick charting. A minor difference between the opening and closing prices forms a small candle body, and a higher difference between the low of the day and the open or close forms a long lower wick (or vertical line). The length of the lower wick being at least twice the length of the real body, the candle resembles a 'hammer.'
In simple terms, during a downtrend, with bears having absolute control, a stock usually opens lower compared to the previous day's close, and again closes lower. On the day the hammer pattern is formed, maintaining the downtrend, the stock makes a new low. However, after eventually finding support at the low of the day, some amount of buying interest emerges, pushing the stock up to close the session near or slightly above its opening price.
When it occurs at the bottom of a downtrend, this pattern signals that the bears might have lost control over the price. And, the success of bulls in stopping the price from falling further indicates a potential trend reversal.
Hammer candles can occur on any timeframe -- such as one-minute, daily, weekly -- and are utilized by both short-term as well as long-term investors.
Like every technical indicator, the hammer chart pattern has its limitations. Particularly, as the strength of a hammer depends on its placement on the chart, it should always be used in conjunction with other bullish indicators.
Here's What Increases the Odds of a Turnaround for SPXC
An upward trend in earnings estimate revisions that SPXC has been witnessing lately can certainly be considered a bullish indicator on the fundamental side. That's because empirical research shows that trends in earnings estimate revisions are strongly correlated with near-term stock price movements.
Over the last 30 days, the consensus EPS estimate for the current year has increased 2.4%. What it means is that the sell-side analysts covering SPXC are majorly in agreement that the company will report better earnings than they predicted earlier.
If this is not enough, you should note that SPXC currently has a Zacks Rank #2 (Buy), which means it is in the top 20% of more than 4,000 stocks that we rank based on trends in earnings estimate revisions and EPS surprises. And stocks carrying a Zacks Rank #1 or 2 usually outperform the market. You can see the complete list of today's Zacks Rank #1 (Strong Buy) stocks here >>>> .
Moreover, the Zacks Rank has proven to be an excellent timing indicator, helping investors identify precisely when a company's prospects are beginning to improve. So, for the shares of SPX Technologies, a Zacks Rank of 2 is a more conclusive fundamental indication of a potential turnaround.
Radical New Technology Could Hand Investors Huge Gains
Quantum Computing is the next technological revolution, and it could be even more advanced than AI.
While some believed the technology was years away, it is already present and moving fast. Large hyperscalers, such as Microsoft, Google, Amazon, Oracle, and even Meta and Tesla, are scrambling to integrate quantum computing into their infrastructure.
Senior Stock Strategist Kevin Cook reveals 7 carefully selected stocks poised to dominate the quantum computing landscape in his report, Beyond AI: The Quantum Leap in Computing Power .
Kevin was among the early experts who recognized NVIDIA's enormous potential back in 2016. Now, he has keyed in on what could be "the next big thing" in quantum computing supremacy. Today, you have a rare chance to position your portfolio at the forefront of this opportunity.
See Top Quantum Stocks Now >>Want the latest recommendations from Zacks Investment Research? Today, you can download 7 Best Stocks for the Next 30 Days. Click to get this free report
SPX Technologies, Inc. (SPXC): Free Stock Analysis Report
This article originally published on Zacks Investment Research (zacks.com).