


Following a much-needed but tenuous Iran peace deal, tensions are again rising in the region. Over the weekend, the New York Times reported that the Iranian navy attacked a container ship in the Strait of Hormuz while also threatening to close the critical waterway. With U.S. forces launching a strike in response, the situation for Delta Air Lines (DAL) appears unfavorable.
Yes, DAL stock currently carries an 88% Strong Buy rating from Barchart’s Technical Opinion indicator. However, there may be early signs that the positive inertia of the security may be fading. For example, it’s true that Delta has gained nearly 26% on a year-to-date basis. It’s also true, though, that it’s down more than 6% in the trailing five sessions.
Can’t Get Enough Options?: Join the list for Barchart’s daily unusual options report, delivered free.
Interestingly, the airliner reported strong results for the second quarter, with some analysts upbeat about the long-term picture. Specifically, they believe Delta can continue to grow despite a volatile geopolitical environment that could easily trigger oil price spikes. Still, DAL stock slipped following the disclosure, likely due to the underlying company absorbing the highest quarterly fuel expense in its history.
Now, there’s a risk in overplaying this hand — it’s certainly possible that the Trump administration backs down from this escalating conflict, which is deeply unpopular with the American people. At the same time, the Iranians have little reason to trust the White House, making this circumstance incredibly difficult to play.
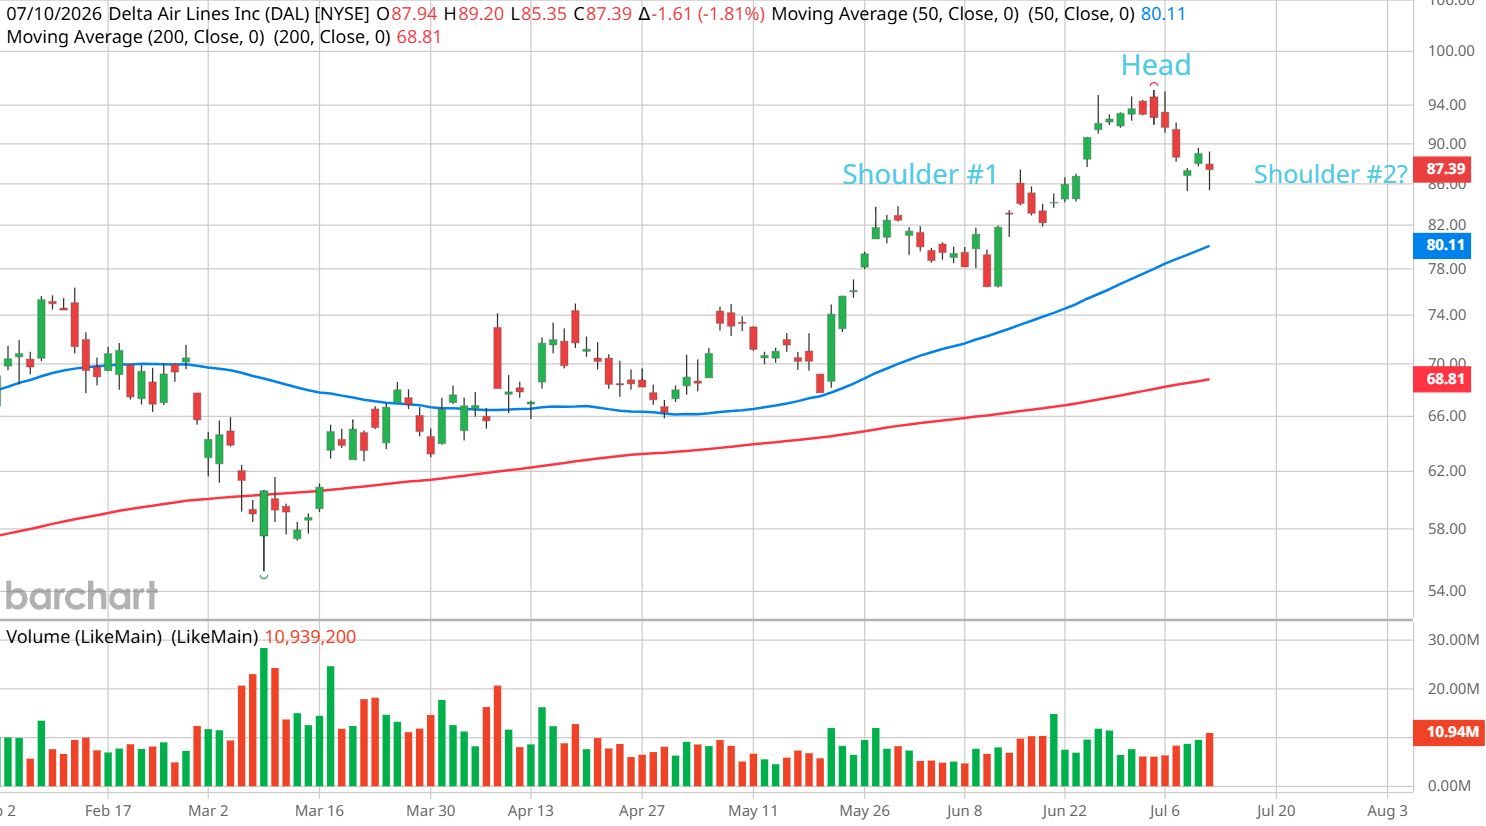
For what it’s worth, DAL stock — if we’re going to talk about technical analysis — does appear to be in the middle of charting a head-and-shoulders pattern. Per the experts of the discipline, such a signal carries a greater probability of a downward move. Essentially, the “mountain peak” formation represents the exhaustion of the bulls, leading to a corrective phase.
But there’s also another signal that I’m interested in.
Using a Quantitative Approach to Trade DAL Stock
While the head-and-shoulders pattern might be intriguing, it’s difficult to verify the implied probability of the signal because of a lack of standardized definition. And since we don’t have objective quantifications available, we don’t know the base rate to determine the odds. One solution, then, is to condition data on quantitative structures.
For example, DAL stock is currently in a state of transition. While the longer-term framework appears bullish, recent sessions appear bearish. In the last 10 weeks, six of these units were up weeks, thereby leading to an overall upward slope. While this 6-4-U sequence — which has materialized 59 times on a rolling basis since January 2019 — appears optimistic, the resultant distribution of outcomes tends to be disappointing.
Over the next 10 weeks, traders may expect a forward median distribution landing between $82.50 and $92.40 (assuming a starting price of $87.39), with probability density peaking at around $87. That means debit-side speculators are statistically prone to incur a slight loss over a 10-week hold.
Even more importantly, if you were to buy Delta stock at random, your 10-week distribution of outcomes will likely land between $85 and $93.50, with probability density peaking at an average price of roughly $89. As a bullish trader, there’s no incentive to buy DAL at this hour if we were simply looking at the inductive data.
But why should these 10-week sequences matter? I’m not sure if 10 weeks as a time period matters in the abstract. Still, the underlying theory is that because modern markets are dominated by algorithmic, rules-based processes, the balance of order flow over a set time period may influence trading behavior.
With DAL stock, its recent history has been saturated with strong, bullish performances. Given this run, there may be a higher probability of a negative mean reversion, especially with a volatile geopolitical event on the horizon.
Going for a Short-Term Swing Trade
Although the distribution of outcomes under 6-4-U conditions isn’t favorable, the trajectory isn’t orderly and linear. In other words, some weeks are projected to be worse than others based on an inductive observation of past data. For DAL stock, there’s a greater risk that it could drop to around a median level of $85 on week 5 (following the aforementioned signal flashing).
If so, the 87/85 bear put spread expiring Aug. 7 could be interesting for directionally agnostic speculators. For a net debit of $122 per spread, a trader would be betting that Delta stock can fall through the $85 strike at expiration, which does seem to be a plausible target when looking at past patterns. Because DAL tends to bounce higher in week 6, the near-term expiry could be a shrewd tactic.
To clarify, I’m not long-term bearish on DAL stock as I would need more evidence to propose such a position. However, in the immediate framework, it wouldn’t be unreasonable to be cautious. It’s not just that Delta has enjoyed a strong performance over the past few months; rather, the fundamental picture is looking shaky, thus warranting a tactical adjustment.
On the date of publication, Josh Enomoto did not have (either directly or indirectly) positions in any of the securities mentioned in this article. All information and data in this article is solely for informational purposes. For more information please view the Barchart Disclosure Policy here.
More news from Barchart
Thanks to Escalating Iran Tensions, Delta Air Lines Stock Could Face Turbulence. How to Trade It Here. Wheat's Bullish Fundamentals Are Growing—So Why Do Prices Keep Falling? Netflix Stock is at New Lows, But Its FCF Is Strong - Is NFLX Too Cheap? Option Volatility And Earnings Report For July 13 - 17