

Wayfair (W) stock jumped 12.3% on Monday. As a result, the online and in-store specialty household goods retailer was one of yesterday’s top 20 bullish price surprises.
Down nearly 6% in 2026, yesterday’s gains helped to boost its positive returns over the past 12 months to 45%. Even better, W shares are up 70% since hitting a 52-week low on May 19.
Can’t Get Enough Options?: Join the list for Barchart’s daily unusual options report, delivered free.
Monday’s gains suggest that the stock’s momentum is still very much intact—further confirmation: the Barchart Technical Opinion is a 56% Buy.
Wayfair’s next earnings date is August 4 before the markets open, a week from today. It’s beaten the analyst’s EPS estimate in three of the last four quarters, averaging a 59% beat. That bodes well for its Q2 2026 results.
The two-year chart below shows that Wayfair’s 30-day MA (moving average) crossed above the 200-day MA for only the second time in the past 24 months. While I’m not a technical analyst, it does suggest that, at least in the near term, the downward trend that began in January has reversed course.
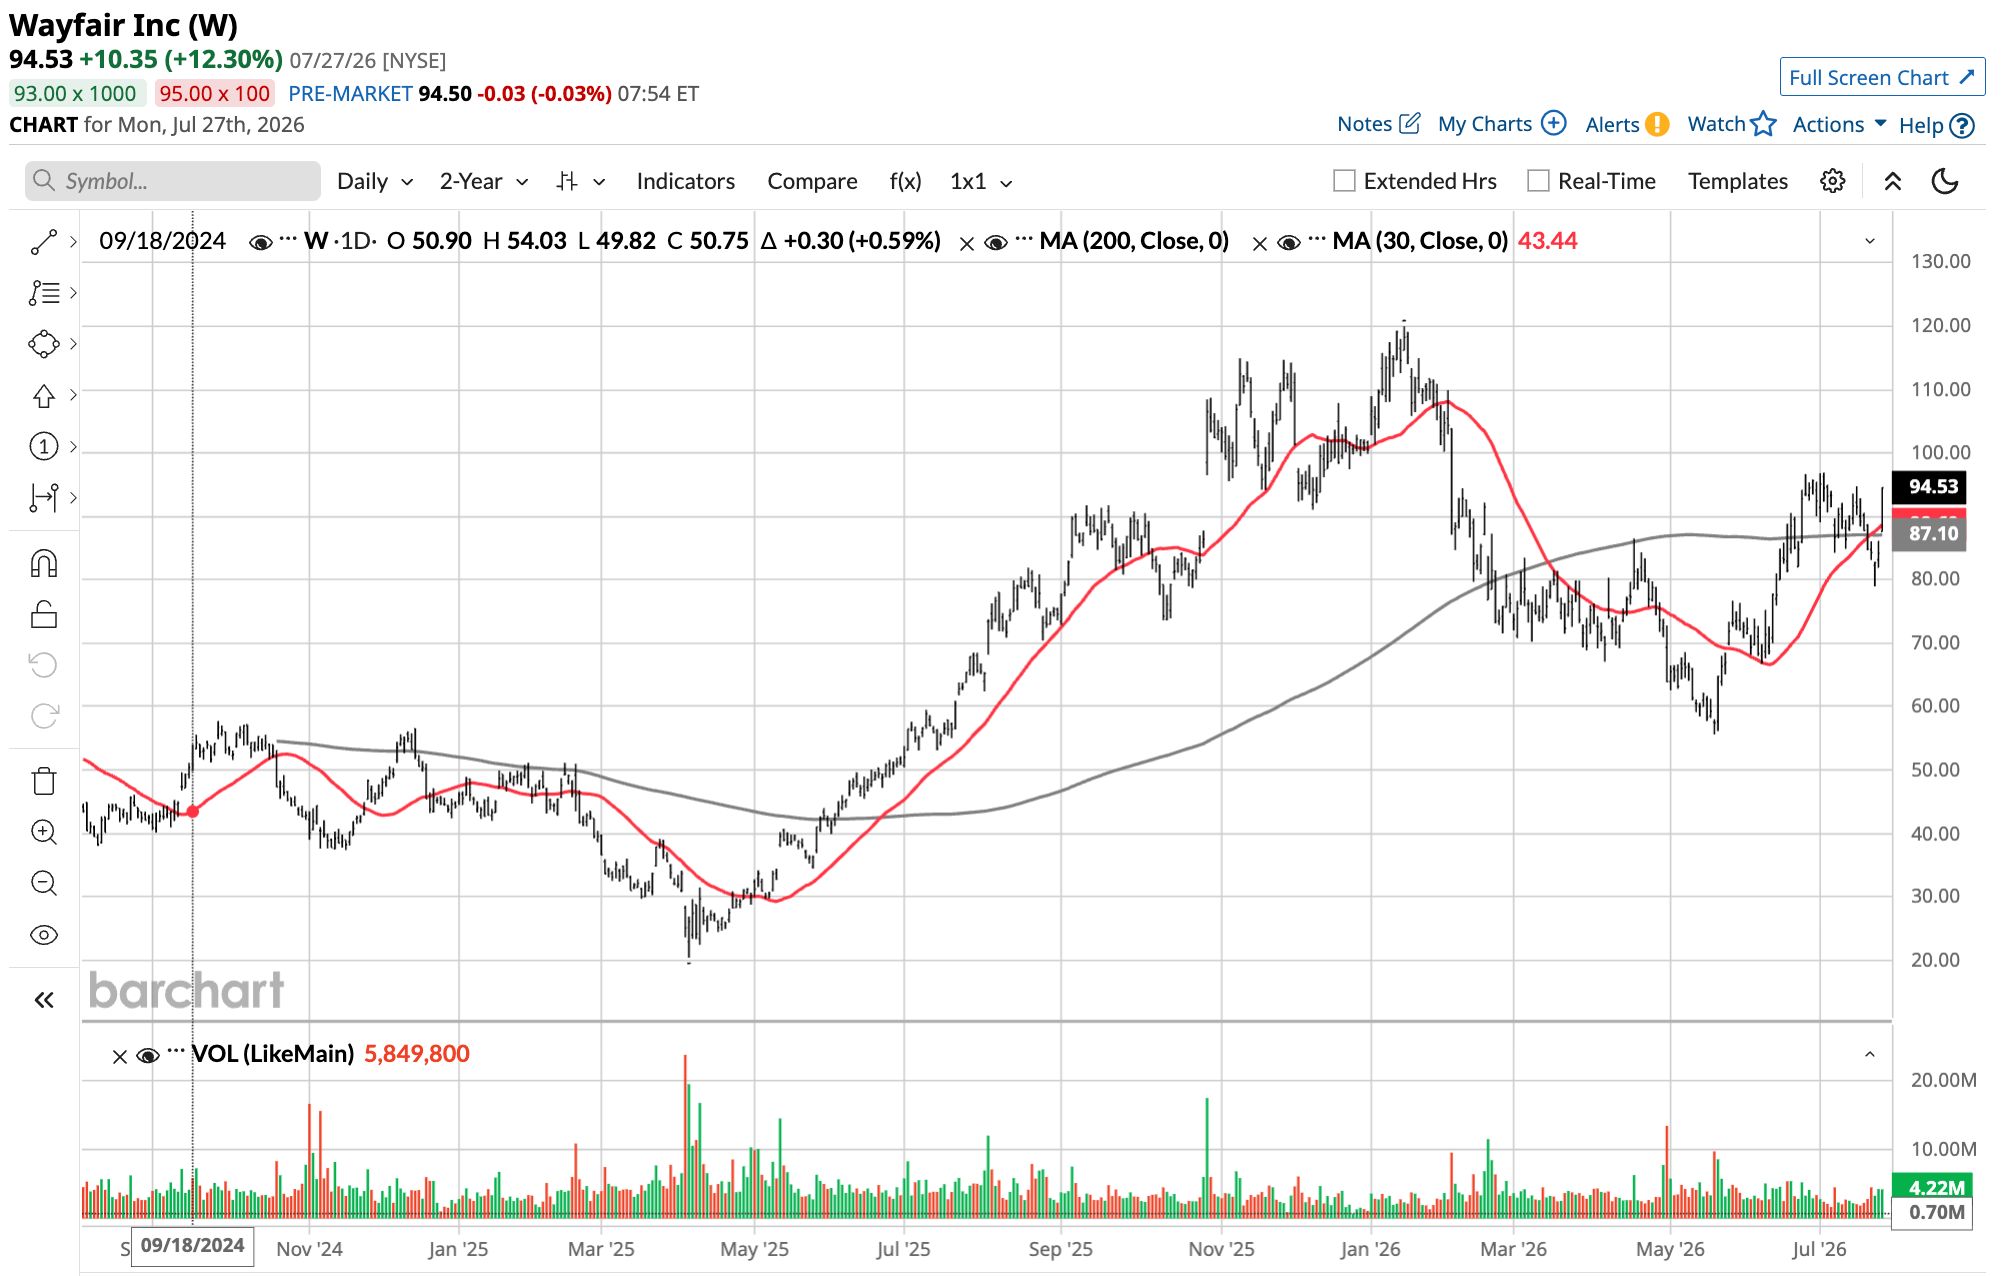
How long will the latest uptick last? The previous time the 30-day MA crossed above the 200-day MA, W went from a low of $20.41 to a high of $119.98, a 489% gain over nine months, before heading lower. Based on the May 19 low of $55.60, and the same 489% gain over nine months, W could be at $272 by February.
Should you buy? No. Here’s why.
Wayfair Stock Remains Expensive
Despite beating earnings estimates in three of the past four quarters, W stock remains expensive.
The current EPS estimate for Q2 2026, according to Yahoo Finance, is $0.92, five cents higher than the estimate three months ago, yet the 2026 estimate has fallen by two cents to $2.81. Its shares trade at nearly 34 times that estimate.
The good news, if it hits that estimate, is that its 2026 EPS would increase by 8% over 2025. The bad news: this figure is non-GAAP. On a GAAP basis, it lost $2.44 a share in 2025. The only time it’s made an annual GAAP profit since going public in 2014 was in 2020 at $1.86 a share on $14.15 billion in revenue. It’s not expected to get back to this level of revenue until 2028, nearly a decade later.
Its operating income in 2020 was $360.3 million, an operating margin of 2.5%; in 2025, it was 0.14%. That’s not the kind of profitability I’m looking for.
I like businesses that generate significant free cash flow (operating cash flow less capital expenditures). Even better if they’re growing it at a decent pace.
The most FCF Wayfair generated in a 12-month period since going public was also in 2020, at $1.23 billion. Based on a Dec. 31, 2020, enterprise value of $23.73 billion, it had a free cash yield of 5.2%. Based on its $488 million in FCF in the 12 months ended March 31, its FCF yield is 3.2%, 200 basis points less. I consider anything between 4% and 8% to be in fair value territory.
2020 was most definitely an outlier year due to COVID. It hasn’t come close to repeating that performance. A 3.2% FCF yield based on a $15.09 billion EV isn’t horrible, but given that translates into a 3.9% FCF margin, there is little room for error here.
One bad quarter, which seems to have been Wayfair’s modus operandi since going public, will send W stock back into the $50s where it was in May.
If I Were to Bet on Wayfair
Although I personally wouldn’t bet on Wayfair because I feel its inconsistent profitability makes it uninvestable, that doesn’t mean you shouldn’t contemplate how to make money from a surging stock.
Given W is up 70% in a little more than two months, a big earnings miss or beat would move the stock substantially in either direction. Implied volatility would be higher than its historical volatility. This brings a Long Straddle or Long Strangle into consideration.
Both expect volatility to increase with a big move in the share price in either direction.
The long straddle involves buying a long call and a long put at the same strike price and expiration date.

As you can see from above, the net debit is $14.25, which represents 15.07% of its $94.53 share price. The maximum loss is the net debit. The maximum profit is unlimited. The likelihood of this making money—W being above $106.25 or below $77.75 at expiration—is 40.4%, which isn’t unreasonable.
The implied volatility of 105.33% is 1.65 times its historical volatility. This means that the cost of the call and put are considerably higher than what you might pay were earnings not around the corner. The options market has priced in an 18.3% expected move by expiration compared to a historical move of 11.1% over the same period.
So, the likelihood of making money on this long straddle is higher on the upside (12.4% gain to breakeven) than on the downside (17.8% loss to breakeven). But given the implied volatility is 1.65 times higher than historical volatility, investors are betting that a big move in either direction is quite possible.
The long strangle involves buying a long call and a long put at a lower strike price. Both have the same expiration date.

As you can see from above, the net debit is $10.95, which represents 11.61% of its $94.33 share price. The maximum loss is the net debit. The maximum profit is unlimited. The likelihood of this making money—W being above $110.95 or below $81.05 at expiration—is 38.7%.
The implied volatility of 109.64% is 1.72 times its historical volatility. The options market has priced in a 19.0% expected move by expiration compared to a historical move of 11.1% over the same period.
So, the likelihood of making money on this long strangle is higher on the downside (14.1% loss to breakeven) than on the upside (17.6% gain to breakeven). Still, investors have priced in possible success in both directions.
While I wouldn’t buy W for the long haul, both the long staddle and long strangle expiring on Aug. 7 are very intriguing.
On the date of publication, Will Ashworth did not have (either directly or indirectly) positions in any of the securities mentioned in this article. All information and data in this article is solely for informational purposes. For more information please view the Barchart Disclosure Policy here.
More news from Barchart
Wayfair Stock’s Rally Sets Up a Volatility Bet Ahead of Earnings on August 4 Why McDonald’s (MCD) Stock Options May Be Offering Value-Meal Pricing Honeywell Aerospace, Just Spun Off, Posted High Q2 FCF Margins; Value Investors Love HONA Stock Tesla Bear Put Spread Could Return 185% in One Month