


Most traders look at earnings, economic data, support and resistance, or the latest headlines to explain why a stock is moving. But there is another force operating underneath the market that can dramatically influence short-term price action: gamma exposure.
Gamma exposure, commonly called GEX, attempts to estimate how options positioning could influence the hedging activity of market makers. And buried inside that data is one particularly important number: the Gamma Flip.
Can’t Get Enough Options?: Join the list for Barchart’s daily unusual options report, delivered free.
The Gamma Flip represents the approximate price where aggregate gamma exposure changes from positive to negative, or vice versa. That matters because the hedging behavior associated with each environment can be very different.
Above the Gamma Flip, positive gamma conditions can contribute to more stable and range-bound price action. Below it, negative gamma conditions can potentially amplify volatility as dealer hedging moves in the same direction as the underlying stock.
In other words, the Gamma Flip can help traders understand not simply where a stock might move, but how it could behave once it gets there.
Why Gamma Exposure Matters
To understand the Gamma Flip, it helps to understand what is happening behind the scenes in the options market.
Market makers facilitating options trades frequently hedge their exposure by buying or selling shares of the underlying stock. As prices move and option deltas change, those hedges may need to be adjusted.
Gamma measures how quickly an option's delta changes as the underlying stock moves. Gamma exposure takes that concept and applies it across the options market to estimate how positioning could influence dealer hedging.
When aggregate gamma is positive, hedging activity can potentially work against the market's direction. Dealers may need to sell into rallies and buy into declines, which can have a stabilizing effect.
Negative gamma can create the opposite dynamic. Hedging flows may instead reinforce the direction of the move, potentially contributing to larger swings and greater volatility.
The Gamma Flip Can Change the Trading Environment
Think about the Gamma Flip as a potential dividing line between two different market environments.
Suppose Nvidia (NVDA) is trading comfortably above its Gamma Flip in a positive gamma environment. The stock may encounter significant options positioning around large call strikes, potentially helping create areas where price becomes more contained.
But if NVDA falls through its Gamma Flip and aggregate gamma turns negative, the dynamics can change.
The same decline that previously attracted stabilizing hedging flows could now produce hedging activity that reinforces the move.
That doesn't mean crossing the Gamma Flip guarantees a breakout, breakdown, or volatility spike. GEX is an estimate based on options positioning, and positions can change quickly.
But it gives traders another piece of information that traditional price charts alone don't provide.
Call Walls and Put Walls Add Another Layer
The Gamma Flip isn't the only useful level inside Barchart's Gamma Exposure data.
Traders can also monitor concentrations of gamma around individual strike prices.
A large concentration of call gamma can create what traders commonly refer to as a Call Wall, while significant positioning on the put side can form a Put Wall.
These levels can help identify areas where options positioning is particularly concentrated.
Instead of choosing an options strike simply because it is near a round number or a traditional support level, traders can compare those technical levels with the positioning already present in the options market.
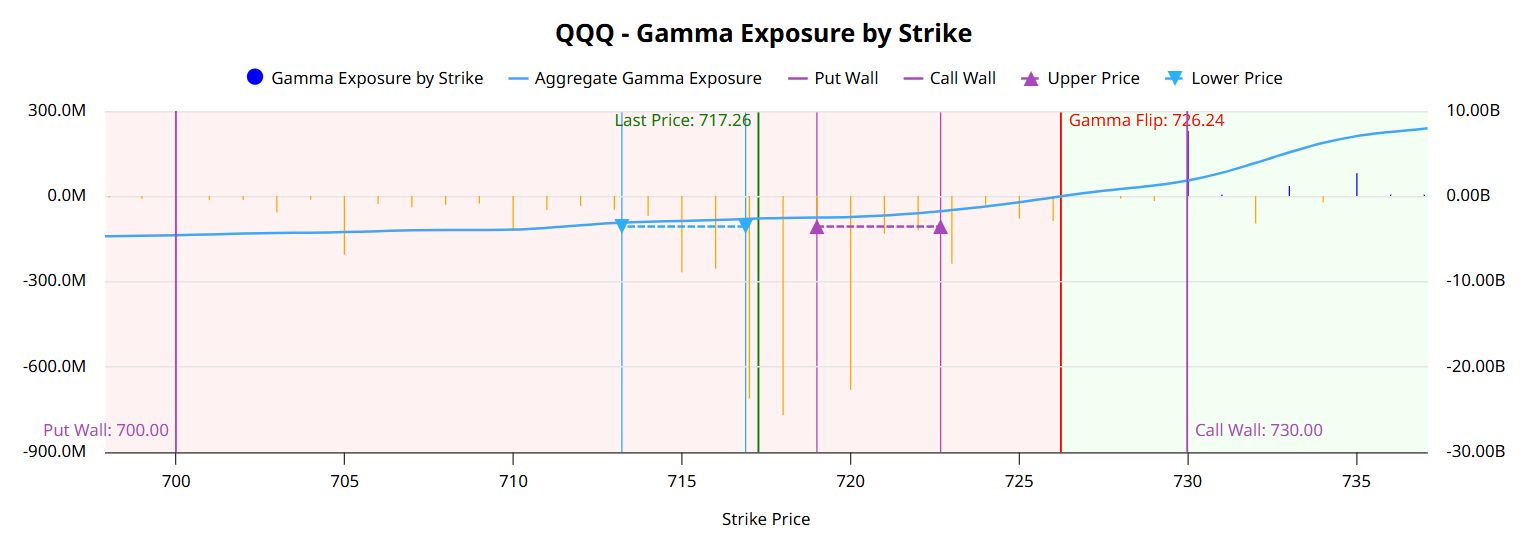 QQQ GEX by strike with call and put walls.
When several pieces of evidence converge around the same price, the level becomes considerably more interesting.
How Traders Can Actually Use GEX
Gamma exposure becomes much more useful when it is combined with other market data rather than treated as a standalone trading signal.
For example, suppose NVDA is approaching its Gamma Flip while also testing a major technical support level.
A trader could then check Barchart's Expected Move to understand how much movement the options market is pricing in, while using the Trader's Cheat Sheet to identify additional support and resistance levels.
Now the setup contains several independent pieces of information:
The technical chart identifies the price level. Expected Move provides context around the magnitude of movement being priced by options traders. Gamma Exposure shows how options positioning and potential dealer hedging could change around that same area.
That's significantly more information than simply looking at a chart and guessing whether support will hold.
GEX Doesn't Predict the Market
Gamma exposure is powerful, but there is an important distinction traders need to understand.
GEX is not a prediction of where a stock will go. It is an estimate of how existing options positioning could influence market behavior.
Earnings, economic reports, geopolitical events, unexpected company announcements, and large institutional trades can overwhelm options-related flows. Options positions themselves can also change throughout the trading session.
That's why Gamma Exposure is best viewed as part of a broader trading framework rather than a standalone buy or sell signal.
The goal isn't to predict the future with one indicator. It's to better understand the environment you're trading in.
The Bottom Line on Options Gamma as an Indicator
Most traders already know where their support and resistance levels are. Far fewer understand how the options market could change what happens when price actually reaches those levels.
That's what makes the Gamma Flip so useful.
It provides a potential dividing line between an environment where dealer hedging may help suppress volatility and one where those same mechanics may contribute to larger price swings. Combined with Call Walls, Put Walls, Expected Move, and traditional technical analysis, GEX can give traders a much deeper view of the forces surrounding a stock.
In our latest video lesson, options expert Rick Orford breaks down Gamma Exposure from the ground up, shows you how to find the Gamma Flip and major gamma levels on Barchart, and walks through Nvidia as a practical example of applying the data to both bullish and bearish setups.
For more on gamma levels in action, check out QQQ Just 'Gamma Flipped' as Market Makers Were Forced to Sell. Here’s What Our Top Chart Expert is Tracking Next. from our Senior Market Strategist John Rowland, CMT.
On the date of publication, Barchart Insights did not have (either directly or indirectly) positions in any of the securities mentioned in this article. All information and data in this article is solely for informational purposes. For more information please view the Barchart Disclosure Policy here.
More news from Barchart
1 Hidden Options Level That Can Change How a Stock Trades Anthropic Just Gave This Bitcoin Miner a Contract Bigger Than the Whole Company What to Know as Guggenheim Ups Its Price Target on MongoDB Stock CEO Lip-Bu Tan Just Bought Another 105,000 Shares of Intel Stock