

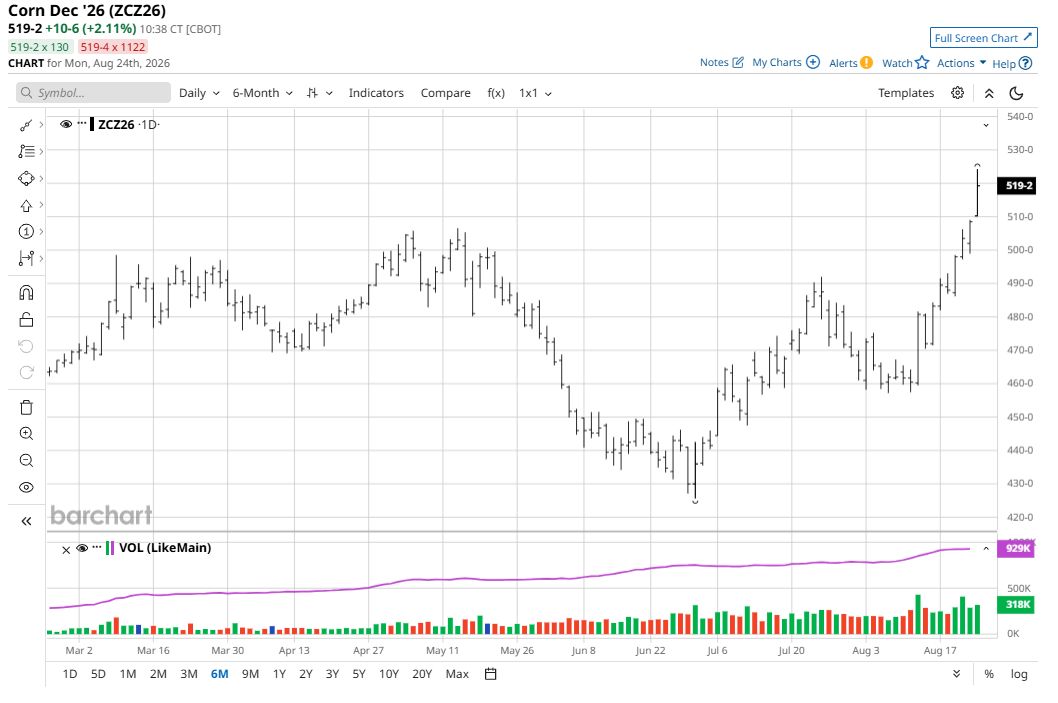
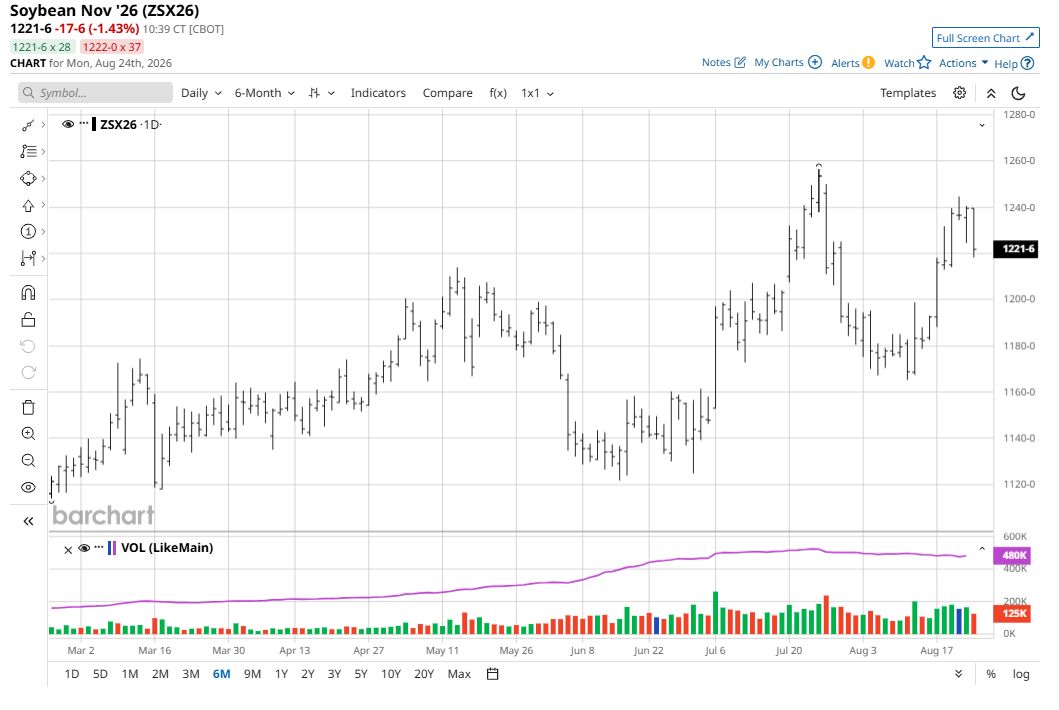
December corn (ZCZ26) rose on Friday 5 cents to $5.08 1/2, near the daily high, and hit a 2.5-year high for the contract. On the week, December corn was up 25 1/4 cents. November soybeans (ZSX26) on Friday rose 3 cents to $12.39 1/2 and for the week were up 47 cents. Friday’s technically bullish weekly high closes in December corn and November soybeans set the stage for follow-through chart-based buying from the speculators early this week.
Both corn and soybeans saw on Friday saw big daily “flash” USDA export sales. Corn saw daily export sales of 205,000 MT to unknown destinations during the 2026-27 marketing year. The agency also reported daily sales of 712,000 MT of U.S. soybeans to China and 720,000 MT of U.S. beans to unknown destinations, each during the 2026-27 marketing year.
Don’t Miss a Day: From crude oil to coffee, sign up free for Barchart’s best-in-class commodity analysis.
A much weaker U.S. dollar index ($DXY) that last week that hit a 2.5-month low has also been helping to boost the grain markets in the past couple weeks.
 www.barchart.com
 www.barchart.com
However, the big news in the grain markets last week that will still have a bullish impact on grain futures this week was the annual Pro Farmer Crop Tour, which saw over 100 scouts tour the main seven U.S. growing states for corn and soybeans: Iowa, Illinois, Indiana, Nebraska, South Dakota, Ohio, and Minnesota. Crop scouts produced surprisingly low yield numbers for corn, at 7.5 bushels per acre below the USDA’s August corn crop forecast — the widest split in six years.
Pro Farmer on Friday afternoon after the grain markets closed said the tour data came out to a national U.S. corn crop production number of 15.344 billion bu. on an average yield of 173.2 bushels per acre. The tour data projected a U.S. soybean crop of 4.572 billion bushels on an average yield of 53.3 bushels per acre. That compares to USDA’s Aug. 12 forecasts of 16.013 billion bu. and 180.7 bu. for corn, and 4.519 billion bu. and 52.7 bu. for soybeans.
So, the crop tour data suggested the corn crop would be 669 million bushels smaller and a U.S. soybean crop 53 million bu. larger than the USDA August supply and demand report.
Corn: Death by a Thousand Paper Cuts
That’s the phrase Pro Farmer economist Lane Akre used for this crop.
Nothing catastrophic happened to the 2026 corn crop. What happened was a sequence of small subtractions that only show up when someone counts. A cold snap after a record-fast planting pace hurt emergence and left ear counts thin. A wet June stunted growth. Heat and dryness after the solstice pushed the crop through pollination too fast, producing tip-back and blank stalks. From the road the crop is deep green and nearly disease-free; in the field the ears are shorter and there are fewer of them.
Said respected veteran ag market and ag policy analyst Jim Wiesemeyer of Wiesemeyer’s Perspectives: “The ear-length data is the tell. Pro Farmer Crop Tour lead data analyst Emily Carolan noted that 7-inch ears — ‘7, 7.2, 7.3’ — are the consistent threshold for big yields, and only six of 33 districts sampled averaged 7 inches or better. Indiana grain length fell 3.9% from last year’s Tour and Illinois 4.8%, with Illinois kernel counts down another 2.3%. In Nebraska the ear count was the lowest since 2013. None of those are headline-grabbing numbers on their own. Multiplied across 88.6 million harvested acres, they are 669 million bushels.”
“Scouts also found the mirror image of 2025 in the east. Last year’s Tour rated Ohio the driest since 2008; this year scouts walked through ankle-deep mud, with nitrogen deficiency visible in Ohio and Illinois where soils stayed saturated. Disease pressure, by contrast, was well below 2025 — southern rust, so widespread a year ago, was largely absent. That is the argument for the crop finishing better than the Tour data suggests, and it is the strongest card USDA holds,” said Wiesemeyer.
He added the soybean story runs the other way, and it is the part of Friday afternoon’s Tour release numbers most likely to be misread. “Pod counts fell in six of seven states, some sharply — South Dakota down 20.4%, Nebraska down 9.5%, Ohio down 7.0%. Yet Pro Farmer still put the national yield at 53.3 bu., above USDA’s 52.7 and a record. Both numbers can be true. The 2025 pod counts were historically high, so ‘down’ still means ‘large’: Illinois pods are 2.9% above the three-year average, Iowa 5.2% above and Minnesota 15.4% above. And soybeans set yield in the last six weeks, not on Tour week. Ample soil moisture, cooler nights and a forecast for less frequent rain is close to the ideal finishing ‘recipe’ for soybeans.”
Wheat Has Its Own Bullish Fundamentals
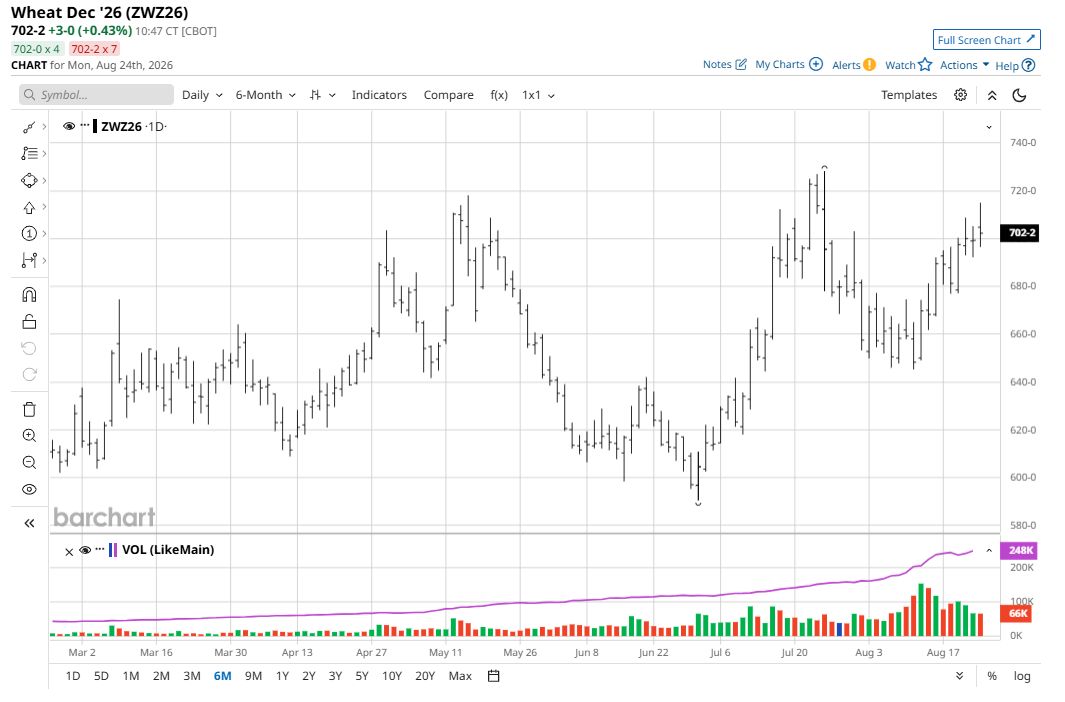
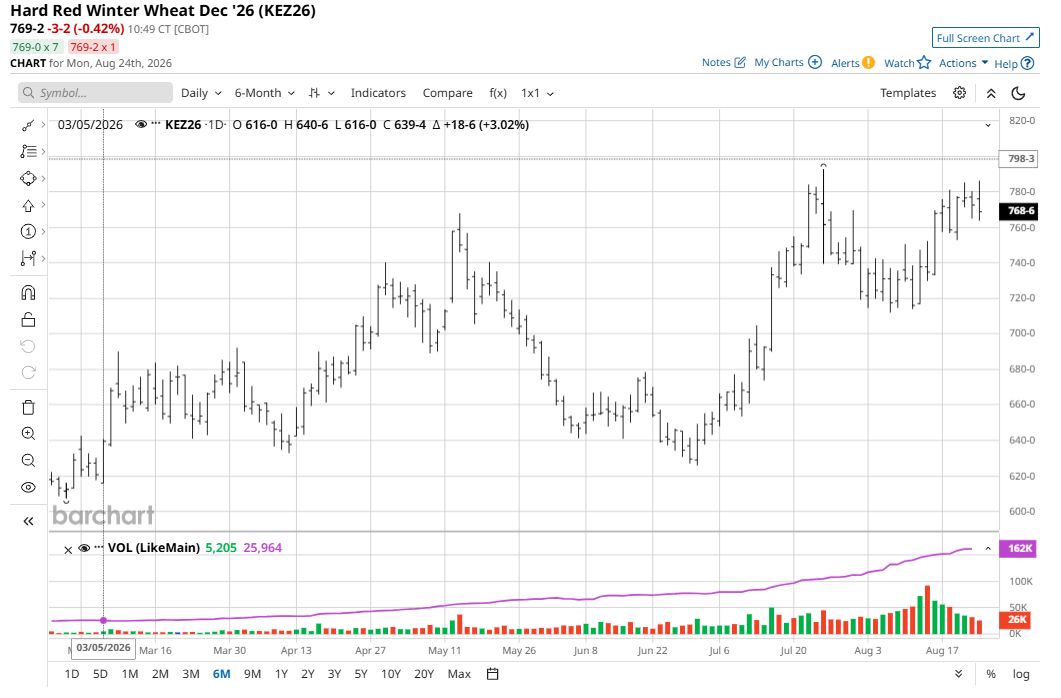
September soft red winter (SRW) wheat (ZWU26) futures on Friday fell 1 1/4 cents to $6.81 ½ and for the week were up 6 3/4 cents. September hard red winter (HRW) wheat (KEU26) Friday lost 6 cents to $7.56 1/4 and on the week were up 2 cents. The winter wheat futures markets saw routine corrective price pullbacks and some profit taking heading into the weekend. Selling interest was limited by gains in corn futures and by ongoing Black Sea wheat shipment disruptions. Reports last week said grain shipments from both Russia and Ukraine have been severely limited by those countries attacking each other’s shipping and grain infrastructure, with Ukraine’s grain shipping virtually completely halted recently — right during its grain harvesting season.
Weather problems in major grain-growing regions of the world are also price-friendly for the wheat futures markets. The U.S. Plains states have seen extreme heat this summer, as has western Europe. Drought in parts of Australian wheat regions have also likely curtailed production potential for crops there.
 www.barchart.com
 www.barchart.com
The weakening U.S. dollar index and bullish overall technical postures for both winter wheat futures markets are also favoring the bullish camps, to suggest more upside price action in the near term.
Let me know what you think. I enjoy hearing from my valued Barchart readers all around the globe. Email me at jim@jimwyckoff.com.
On the date of publication, Jim Wyckoff did not have (either directly or indirectly) positions in any of the securities mentioned in this article. All information and data in this article is solely for informational purposes. For more information please view the Barchart Disclosure Policy here.