

Given the current political environment, a rate hike by the Federal Reserve wasn’t on my bingo card. Nevertheless, it happened and the market quickly soured on big banking giant Citigroup (C). For the midweek session, Citi stock ended up dropping more than 2%, likely a consequence of accelerated deposit beta.
While a rate hike theoretically allows banks to expand net interest income, a hawkish Fed force money-center banks to raise rates on interest-bearing deposits rapidly to retain client cash against higher-yielding alternatives like money market funds. This circumstance could compress net interest margin (NIM) gains far quicker than loan yields can reprice.
Can’t Get Enough Options?: Join the list for Barchart’s daily unusual options report, delivered free.
As such, it wasn’t unexpected that, following the Fed announcement, C stock fell sharply. For context, the ticker is still up nearly 14% on a year-to-date basis. However, with the rising rates comes a macro risk about the possibility of a late-cycle recession. Because of the added news-driven fear, it’s only natural for investors to be skeptical about the big bank.
Take for example the 135/140 bull call spread expiring Oct. 16. For this trade to be fully profitable, Citigroup stock must trigger the $140 second-leg strike price at expiration. Doing so will generate a maximum payout of over 139%. That’s a significant potential reward for about five weeks’ worth of speculation.
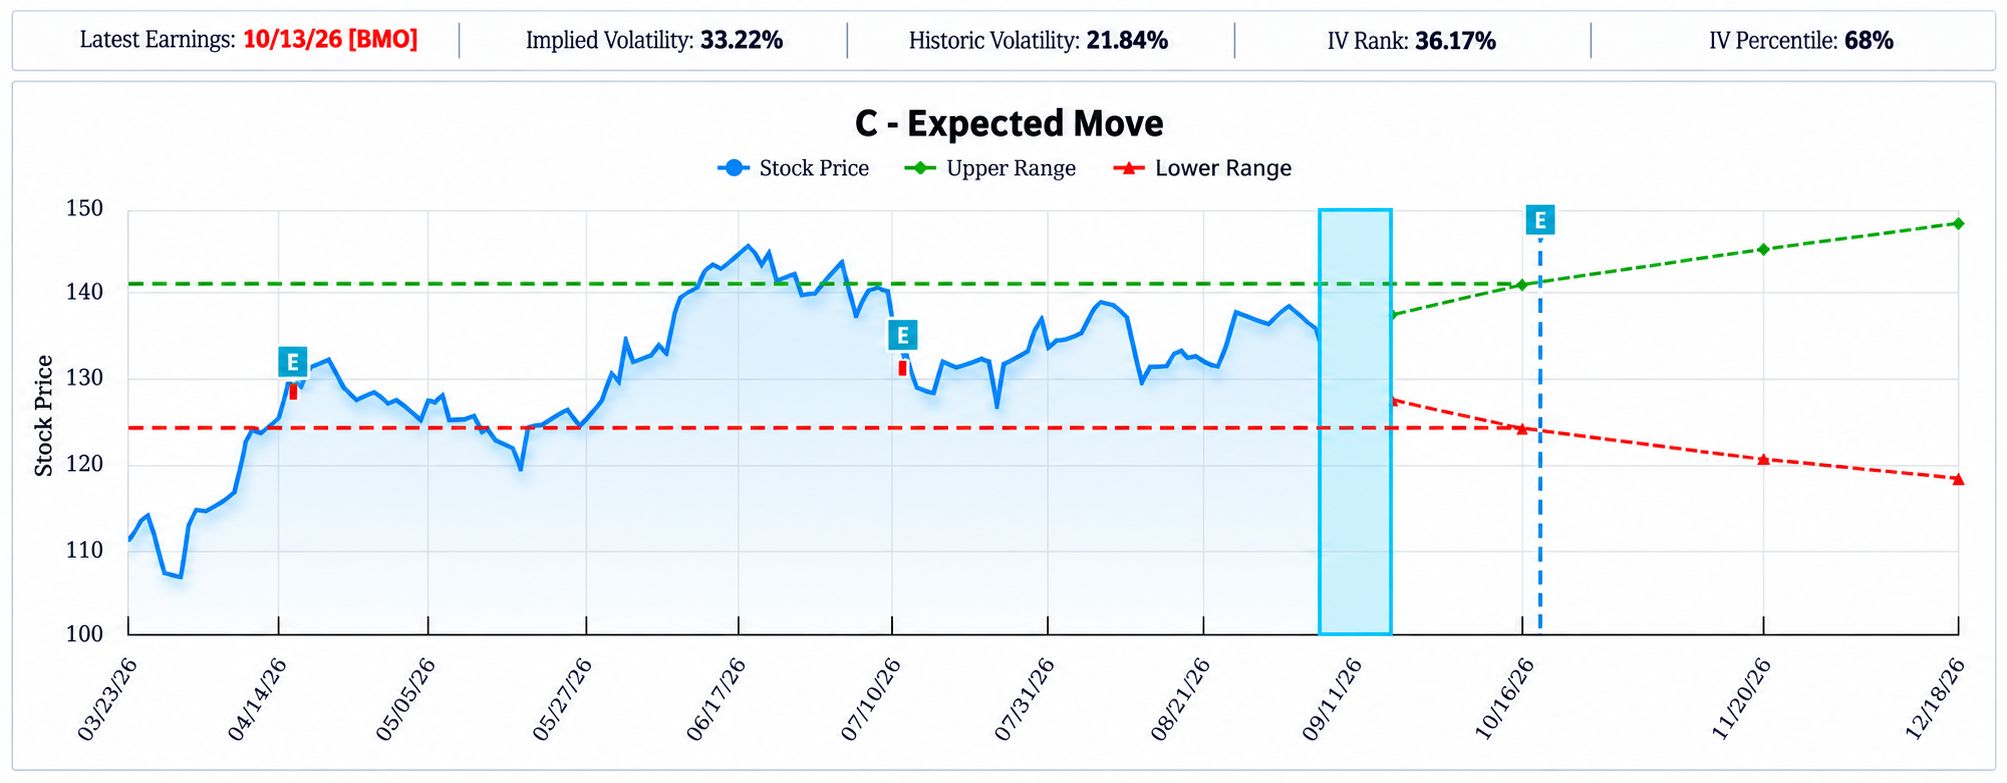
But even if the $140 price level represents the next psychological target, there’s a catch: Wall Street defines the probability of breakeven at only 37.4%. Worse yet, a reverse-engineering of Barchart’s Expected Move calculator reveals that the odds of Citi stock hitting the second-leg strike at expiration sit at a modest 30.08%.
From the looks of it, the 135/140 bull spread is a terrible proposition. However, a shift in framework could change how you ultimately perceive Citigroup stock.
Looking for a Mispricing in Citi Stock
Any time a forecast is made about the unknown future, an argument must utilize a presupposition to get the discussion moving. By accepting the above probabilities as stated, the mechanism has already presupposed that Citigroup stock will undergo a random walk between now and the expiration date. If such a walk occurred, then the odds would most accurately reflect market reality.
Certainly, the calculations that went into the above framework that eventually yielded the breakeven and full profitability odds of 37.4% and 30.08%, respectively, are useful because they integrate both the current share price and the implied volatility (IV). Of course, IV is the expected forward movement of a security and this figure itself stems from actual orders.
In other words, the basis by which the probabilities are derived represents actual demand. But then, this demand is filtered through the lens of a random walk framework, which then follows that the subsequent probabilistic estimate is memoryless. Simply put, the future is independent of the past.
Because these probabilities represent the standard benchmark of publicly disseminated knowledge, it’s difficult to extract a mispricing edge just from the raw information itself. Rather, an analysis needs to present an alternative framework that presents a different set of probabilities. If the variance is large enough, there could be a favorable mispricing — provided that this alternative presupposition is indeed valid.
A Path-Dependent Approach Provides Another Perspective for Citigroup Stock
What if we change our initial presupposition to assume a nonrandom walk? That is, what if we calculated the potential trajectory of Citi stock based on a path-dependent model, where the future is directly influenced by the material past? Under this set of calculations, we may arrive at different probabilistic conclusions.
Thanks to recent events, Citigroup stock has recently printed six up weeks over the last 10 weekly candlesticks. Ordinarily, this sequence (which involves 60% positive sessions) should result in an upward slope across the total 10-week period. Instead, Citi has printed a downward slope, which is fairly unique signal.
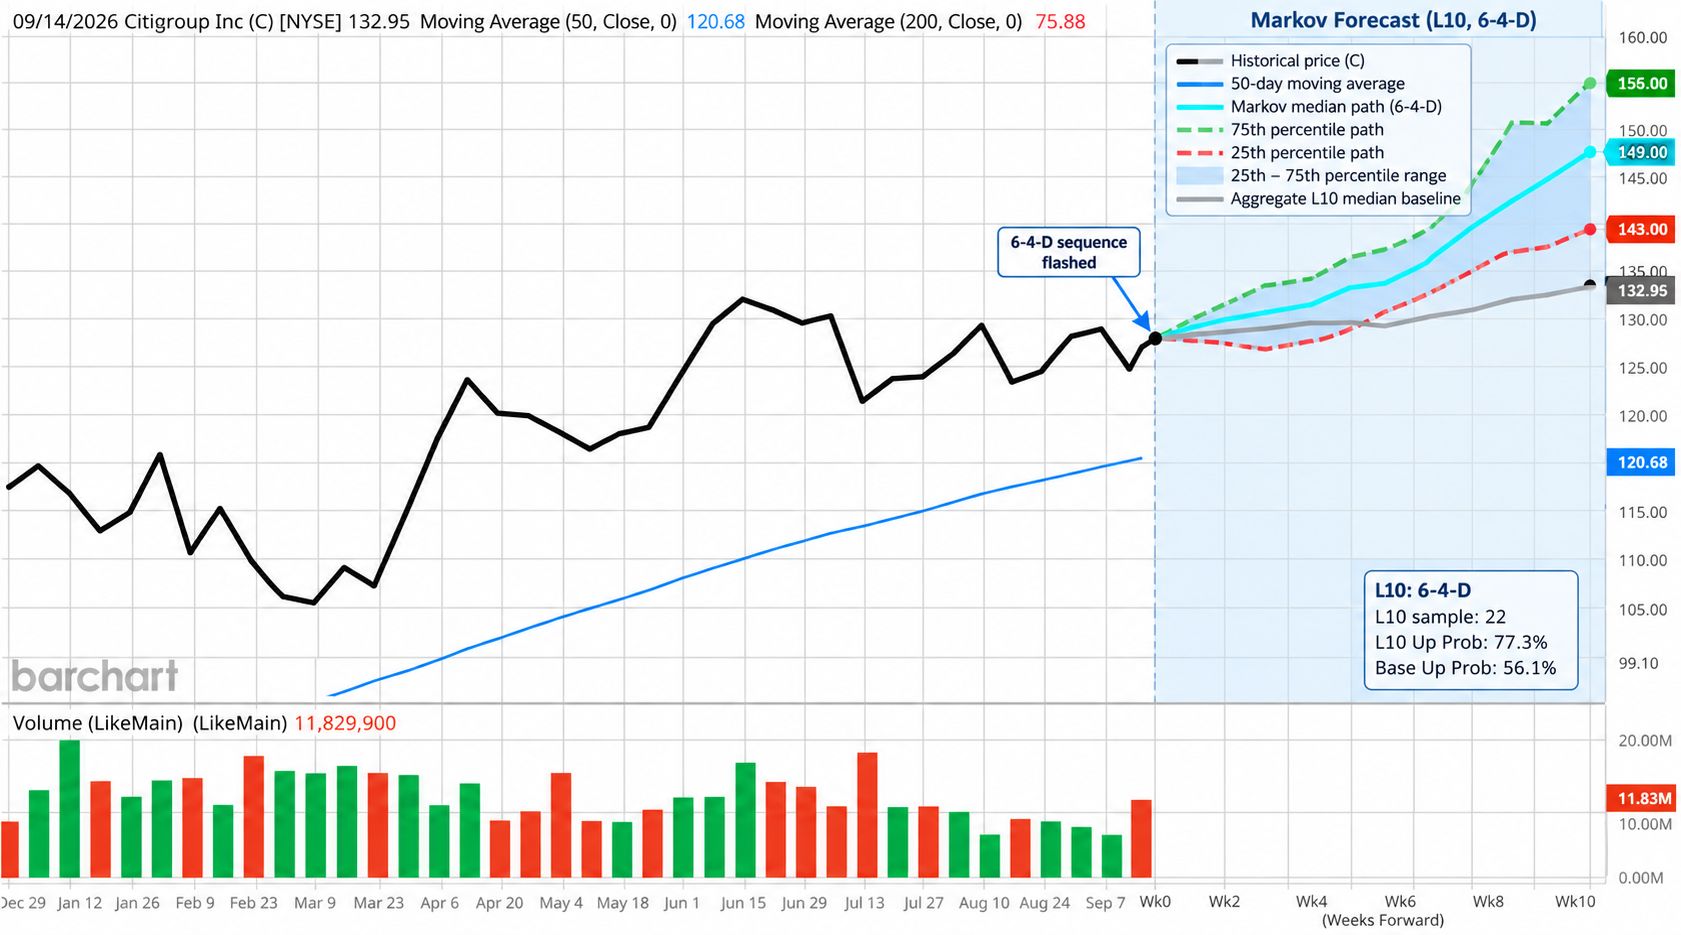
Looking at historical data going back to January 2019, we know that this particular behavioral state has flashed 22 times on a rolling basis. We also know that in the fifth week (coinciding roughly with the Oct. 16 expiration date), the median terminal price is the equivalent of $140.
Yes, there are huge problems with the low sample size, indicating low statistical confidence. However, as an empirically observed trend within the given time period, the odds of full profitability of the 135/140 bull spread may be 50%.
Of course, that comes out to a coin flip, which is not the most convincing argument. Nevertheless, if a path-dependent approach genuinely calculates 50% odds, then it would mean that Wall Street may be mispricing the 135/140 bull spread, as the standard probability of 30.08% is noticeably lower.
A Caveat Before Jumping on the Trade
While the positive variance between a path-dependent and path-independent approach may be attractive, it’s important to reiterate that both models are presuppositions. There’s no such thing as an absolute, determinative indicator of the unknown future. Therefore, the best that we can do is to make an educated guess.
My main point is not to say one model is right over the other; it’s that once we acknowledge Wall Street’s benchmark for pricing risk in the derivatives market, we should explore alternative theories. If you find another hypothesis convincing — and if it potentially offers an edge between signal and noise — then an opportunity may be available.
That doesn’t necessarily mean that an edge absolutely exists; again, future forecasts are presuppositional. But in the case of Citi stock, the pessimism toward the ticker could be overstated, as a different perspective appears to yield vastly different conclusions.
On the date of publication, Josh Enomoto did not have (either directly or indirectly) positions in any of the securities mentioned in this article. All information and data in this article is solely for informational purposes. For more information please view the Barchart Disclosure Policy here.
More news from Barchart
Wall Street May Have Overpriced the Fed Rate Hike’s Impact on Citigroup Stock Spreads Analyzing a Butterfly Spread on Microsoft Large, Unusual Volume in Long-Dated Apple Put Options Shows Investors Bullish in AAPL Wall Street Could Be Overpricing the Risk of Coherent Stock Call Spreads