


CME Group's CME second-quarter 2026 adjusted earnings of $2.99 per share beat the Zacks Consensus Estimate of $2.91 by 2.7%. The bottom line increased 1% from the year-ago quarter. Revenues of $1.70 billion surpassed the consensus estimate of $1.68 billion by 1.2% and rose 1% year over year.
The quarter benefited from record market data revenues and resilient trading activity, with average daily volume reaching 29.8 million contracts, the third-highest quarterly level in the company's history.
CME Group Inc. Price, Consensus and EPS Surprise
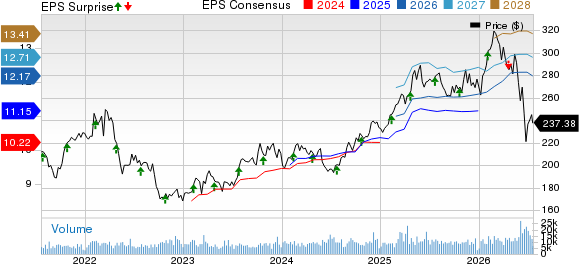
CME Group Inc. price-consensus-eps-surprise-chart | CME Group Inc. Quote
CME’s Revenue Growth Supported by Market Data
Revenue growth was driven by record market data and information services revenues, which rose 20% year over year to $238.1 million. Clearing and transaction fee revenues totaled $1.35 billion, while total revenues increased to $1.71 billion from $1.69 billion in the prior-year quarter.
The company also generated $115.6 million in other revenues, which grew 9.2% year over year. Total average rate per contract improved to 67.8 cents from 65.2 cents in the first quarter of 2026, reflecting lower volume tiering and a lower member mix.
CME Group Trading Activity Remains Robust
Trading activity remained strong despite lapping a record second quarter of 2025. Average daily volume totaled 29.8 million contracts, representing the company's third-highest quarterly ADV.
Financial products averaged 24.2 million contracts daily, while commodities averaged 5.7 million. Equity Index ADV increased 13% year over year to 8.6 million contracts, Agricultural products ADV rose 6% to a record quarterly level of 2.1 million, and Metals ADV advanced 5% to 865,000 contracts. Non-U.S. ADV reached 9.1 million contracts, marking the third-highest international quarterly volume in the company's history.
CME Expenses Rise as Profitability Stays Solid
Total expenses increased to $599.1 million from $562.7 million in the year-ago quarter. Operating income was $1.11 billion compared with $1.13 billion a year earlier.
On an adjusted basis, operating expenses were $521.2 million and adjusted operating income totaled $1.19 billion. Adjusted operating margin remained strong at 69.5%, while adjusted net income increased 1% year over year to $1.08 billion.
CME’s Innovation Expands Product Portfolio
CME continued to broaden its product lineup during the quarter. The company commenced 24/7 trading for its cryptocurrency futures suite and announced that 1-Ounce Gold futures would also begin trading around the clock.
Management also unveiled plans to launch Single Stock futures during the third quarter of 2026, introduce Compute futures later this year, roll out Treasury Link in the fourth quarter and expand CME Securities Clearing. These initiatives are intended to broaden the customer base and strengthen risk-management capabilities across asset classes.
CME’s Balance Sheet and 2026 Outlook
CME ended the quarter with approximately $2.3 billion in cash and $3.4 billion of debt. During the quarter, the company paid regular dividends of approximately $468 million and repurchased $695 million of common shares.
Management expects full-year adjusted operating expenses, excluding license fees, of approximately $1.695 billion and capital expenditures, net of leasehold improvement allowances, of roughly $85 million. The adjusted effective tax rate is projected to be at the low end of the previously communicated 23.5-24.5% range. July trading activity has remained strong, with average daily volume trending toward the highest July in company history.
Zacks Rank
CME currently sports a Zacks Rank #4 (Sell).
You can see the complete list of today’s Zacks #1 Rank (Strong Buy) stocks here.
Performance of Other Industry Players
The Progressive Corporation’s PGR second-quarter 2026 earnings per share of $4.85 beat the Zacks Consensus Estimate by 3.2%. The bottom line, however, decreased 6.1% year over year. Net premiums written were $21.1 billion in the quarter, up 5% from $20.1 billion a year ago.
Net premiums earned grew 6% to $21.6 billion. The reported figure met the Zacks Consensus Estimate. Net realized gains on securities were $604 million, up 56% year over year. Combined ratio — the percentage of premiums paid out as claims and expenses — deteriorated 110 basis points from the prior-year quarter’s level to 87.1.
The Travelers Companies, Inc. TRV reported second-quarter 2026 core income of $10.04 per share, which beat the Zacks Consensus Estimate of $5.21 by 92.7%. The bottom line climbed 54% year over year. Revenues of $12.09 billion missed the Zacks Consensus Estimate of $12.27 billion by 1.5%.
Net investment income rose 14% year over year to $1.07 billion pre-tax ($883 million after tax). The combined ratio improved 670 basis points year over year to 83.6%, reflecting lower catastrophe losses, stronger reserve development and a better underlying combined ratio.
W.R. Berkley Corporation WRB reported second-quarter 2026 operating income of $1.27 per share, which beat the Zacks Consensus Estimate by 16.5%. The bottom line increased 21% year over year. W.R. Berkley’s net premiums written were about $3.4 billion, up 2.4% year over year. The figure surpassed our estimate of $3.4 billion.
Operating revenues totalled $ 3.8 billion, up 3.6% year over year. The top line surpassed the consensus estimate by 1.87%. Net investment income grew 10.4% to $418.7 million, supported by higher invested assets and higher portfolio yields. The figure topped our estimate of $407 million. The consensus estimate was $395.6 million.
Beyond Nvidia: AI's Second Wave Is Here
The AI revolution has already minted millionaires. But the stocks everyone knows about aren't likely to keep delivering the biggest profits. AI’s second wave is moving from infrastructure to implementation and these companies are at the forefront of this transition, positioned to become what Amazon and Google were to the internet era.
See Stocks Now >>Want the latest recommendations from Zacks Investment Research? Today, you can download 7 Best Stocks for the Next 30 Days. Click to get this free report
CME Group Inc. (CME): Free Stock Analysis Report
The Travelers Companies, Inc. (TRV): Free Stock Analysis Report
W.R. Berkley Corporation (WRB): Free Stock Analysis Report
The Progressive Corporation (PGR): Free Stock Analysis Report
This article originally published on Zacks Investment Research (zacks.com).