


Selective Insurance Group, Inc. SIGI reported second-quarter 2026 operating earnings of $1.95 per share, which beat the Zacks Consensus Estimate by 13.4%. The bottom line increased 48.9% year over year.
Revenues of $1.37 billion rose 4.5% from the year-ago quarter and topped the consensus estimate by 0.7%. Results benefited from stronger investment income and improved underwriting, while lower premiums written reflected continued portfolio actions.
Selective Insurance Group, Inc. Price, Consensus and EPS Surprise
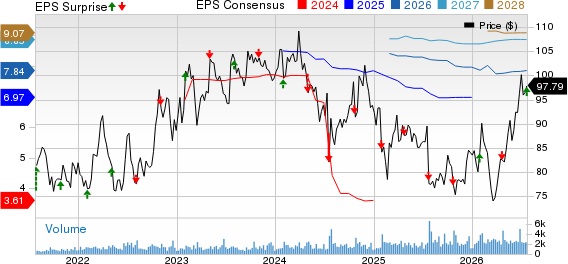
Selective Insurance Group, Inc. price-consensus-eps-surprise-chart | Selective Insurance Group, Inc. Quote
SIGI's Underwriting Results Improve
Net premiums written declined 5% year over year to $1.22 billion due to a 6% decrease in Standard Commercial Lines, an 8% fall in Standard Personal Lines, and a 2% decline in Excess and Surplus Lines. Our estimate was $1.33 billion.
Net premiums earned increased 2.3%. Direct new business fell to $206.1 million from $248.1 million. Renewal pure price increases averaged 6.5%, down from 9.9% in the prior-year quarter.
The combined ratio improved 220 basis points to 98%. Lower catastrophe and non-catastrophe property losses, along with no prior-year casualty reserve development, supported the improvement. Higher current-year casualty loss costs partly offset these benefits.
SIGI's Investment Income Adds Support
After-tax net investment income increased 18% year over year to $119.2 million. Net investment income per common share rose 20% to $1.98.
The after-tax yield was 4.4% for fixed-income securities and 4.2% for the overall portfolio. Investment income contributed 13.9 percentage points to annualized return on equity, up from 13 points a year ago.
SIGI's Commercial Lines Performance Strengthens
Standard Commercial Lines net premiums written fell 6% year over year to $961.9 million as lower new business weighed on production. Our estimate was $1 billion.
Net premiums earned rose 3% to $962 million, while retention was 81%.
The segment's combined ratio improved 350 basis points to 99.3%. The improvement reflected no prior-year casualty reserve development and lower non-catastrophe property losses, partly offset by higher current-year casualty loss costs.
SIGI's Personal Lines Margin Narrows
Standard Personal Lines net premiums written declined 8% to $101.5 million, while net premiums earned decreased 5% to $97.6 million. Our estimate for net premiums written was $111.4 million. New business fell 36%, renewal pure price increased 8.9% and retention remained at 79%.
The segment's combined ratio deteriorated 390 basis points to 95.5%. Higher non-catastrophe property losses and a higher expense ratio pressured the result, though lower catastrophe losses provided some relief.
SIGI's Excess and Surplus Results Stay Profitable
Excess and Surplus Lines net premiums written decreased 2% year over year to $157.3 million. Our estimate was $174.7 million. Net premiums earned increased 5% to $155.8 million, while average renewal pure price rose 3.4%.
The segment's combined ratio increased 200 basis points to 91.8%. Higher current-year casualty loss costs and non-catastrophe property losses more than offset lower catastrophe losses.
SIGI's Profitability and Capital Improve
After-tax underwriting income was $19.3 million against a loss of $1.9 million a year earlier. Non-GAAP operating income climbed 46% to $117.6 million, while net income available to common stockholders increased 52% to $127.1 million.
Operating return on common equity improved 340 basis points year over year to 13.7%. The company marked its eighth consecutive quarter of double-digit operating returns.
Total expenses increased slightly to $1.22 billion from $1.21 billion, reflecting higher other insurance expenses. Our estimate was $1.24 billion.
SIGI's Balance Sheet Gains Ground
Selective Insurance ended the quarter with total assets of $15.62 billion, up 3% from year-end 2025. Total investments increased 2% to $11.58 billion, while common stockholders' equity rose 2% to $3.46 billion.
Book value per common share was $58.13, up 3% sequentially, while adjusted book value per share increased 3% to $60.56. During the quarter, the company repurchased $32 million of shares at an average price of $84.72.
Selective Insurance Raises Investment Income Outlook
For 2026, Selective Insurance continues to expect a GAAP combined ratio of 96.5-97.5, including 6 points of catastrophe losses. The outlook assumes no prior-year casualty reserve development.
The company raised its after-tax net investment income guidance to $480 million from $465 million. It continues to project an effective tax rate of 21.5% and now expects weighted average diluted shares of 60.2 million.
Zacks Rank
Selective Insurance currently carries a Zacks Rank #3 (Hold). You can see the complete list of today’s Zacks #1 Rank (Strong Buy) stocks here.
Performance of Other Property and Casualty Insurers
Chubb Limited CB reported second-quarter 2026 core operating earnings of $7.26 per share, which beat the Zacks Consensus Estimate of $6.63 by 9.5%. The bottom line increased 18.2% year over year. Revenues rose 2.7% year over year to $15.77 billion but missed the consensus mark of $15.90 billion by 0.8%.
Stronger P&C underwriting, record investment income, and higher life insurance income supported results. Net premiums earned increased 5.8% to $13.89 billion. P&C underwriting income increased 18.8% year over year to $1.94 billion. The combined ratio improved 180 basis points to 83.8%, reflecting a lower share of premiums consumed by claims and expenses. Our estimate was $1.15 billion.
The Travelers Companies, Inc. TRV reported second-quarter 2026 core income of $10.04 per share, which beat the Zacks Consensus Estimate of $5.21 by 92.7%. The bottom line climbed 54% year over year. Revenues of $12.09 billion missed the Zacks Consensus Estimate of $12.27 billion by 1.5%.
Net investment income rose 14% year over year to $1.07 billion pre-tax ($883 million after tax). The combined ratio improved 670 basis points year over year to 83.6%, reflecting lower catastrophe losses, stronger reserve development and a better underlying combined ratio.
W.R. Berkley Corporation WRB reported second-quarter 2026 operating income of $1.27 per share, which beat the Zacks Consensus Estimate by 16.5%. The bottom line increased 21% year over year. W.R. Berkley’s net premiums written were about $3.4 billion, up 2.4% year over year. The figure surpassed our estimate of $3.4 billion.
Operating revenues totaled $ 3.8 billion, up 3.6% year over year. The top line surpassed the consensus estimate by 1.87%. Net investment income grew 10.4% to $418.7 million, supported by higher invested assets and higher portfolio yields. The figure topped our estimate of $407 million. The consensus estimate was $395.6 million.
7 Best Stocks for the Next 30 Days
Just released: Experts distill 7 elite stocks from the current list of 220 Zacks Rank #1 Strong Buys. They deem these tickers "Most Likely for Early Price Pops."
Since 1988, the full list has beaten the market more than 2X over with an average gain of +23.9% per year. So be sure to give these hand picked 7 your immediate attention.
See them now >>Want the latest recommendations from Zacks Investment Research? Today, you can download 7 Best Stocks for the Next 30 Days. Click to get this free report
Selective Insurance Group, Inc. (SIGI): Free Stock Analysis Report
The Travelers Companies, Inc. (TRV): Free Stock Analysis Report
Chubb Limited (CB): Free Stock Analysis Report
W.R. Berkley Corporation (WRB): Free Stock Analysis Report
This article originally published on Zacks Investment Research (zacks.com).