

Wynn Resorts, Limited WYNN reported second-quarter 2026 results, with earnings and revenues beating the Zacks Consensus Estimate. The top and bottom lines increased on a year-over-year basis.
Management highlighted healthy demand across the business, including a monthly Adjusted Property EBITDAR record in Las Vegas during May and strong performance in Macau. Wynn Palace led the quarter’s growth, with revenues rising 21.1% and Adjusted Property EBITDAR increasing 28.2% year over year.
WYNN’s Q2 Earnings & Revenues
In the second quarter, the company reported adjusted earnings per share of $1.24, beating the Zacks Consensus Estimate of $1.01 by 22.8%. In the prior-year quarter, Wynn Resorts reported adjusted earnings of $1.09 per share.
Quarterly operating revenues of $1.86 billion surpassed the consensus mark of $1.84 billion by 0.9%. The top line increased 6.9% from $1.74 billion reported in the year-ago quarter.
Wynn Resorts, Limited Price, Consensus and EPS Surprise
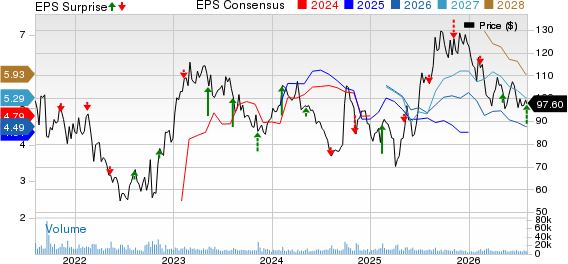
Wynn Resorts, Limited price-consensus-eps-surprise-chart | Wynn Resorts, Limited Quote
Wynn Palace Operations
In the second quarter, Wynn Palace’s operating revenues amounted to $653.4 million compared with $539.6 million in the prior-year quarter. Casino revenues increased 25.9% year over year to $564.4 million, while food and beverage revenues rose 4.4% to $31.8 million.
Rooms and entertainment, retail and other revenues declined 6% each to $36.2 million and $21.1 million, respectively. Adjusted Property EBITDAR increased to $201.5 million from $157.2 million, with the margin improving to 30.8% from 29.1%.
In the VIP segment, table games turnover declined 32% year over year to $2.77 billion. The VIP table games win rate was 2.97% compared with 2.86% in the prior-year quarter and remained below the property’s expected range of 3.1% to 3.4%.
Mass-market table drop increased 3% to $1.9 billion, while table games win rose 36.9% to $563.3 million. The mass-market table games win percentage improved to 29.7% from 22.3%. RevPAR declined 5.7% to $216, while occupancy was 98.9%.
WYNN’s Wynn Macau Operations
In the second quarter, Wynn Macau generated operating revenues of $351.1 million compared with $343.8 million reported in the prior-year quarter. Casino revenues increased 2.5% to $300.7 million, while entertainment, retail and other revenues rose 8.7% to $12.7 million.
Rooms and food and beverage revenues declined 3.8% and 1.5% to $20.9 million and $16.8 million, respectively. Adjusted Property EBITDAR declined 1% to $95.5 million from $96.5 million.
VIP table games turnover fell 56.4% year over year to $428.1 million. The VIP win rate declined to 2.58% from 3.41% and remained below the expected range.
Mass-market table drop rose 8.3% to $1.75 billion, and table games win increased 6.9% to $300.2 million. Slot machine handle advanced 18%, while slot machine win climbed 38.6%. RevPAR declined 3.3% to $208.
Wynn Resorts’ Las Vegas Operations
In the second quarter, operating revenues from Las Vegas Operations totaled $643.2 million compared with $638.6 million in the prior-year quarter. Casino revenues increased 6.5% to $158.1 million, while room revenues edged up 0.1% to $208.1 million.
Food and beverage revenues rose 0.4% to $195.7 million. Entertainment, retail and other revenues declined 6.9% to $81.2 million. Adjusted Property EBITDAR decreased 8.3% to $215.2 million, with the margin contracting to 33.5% from 36.8%.
Table drop increased 4.8% year over year to $638.2 million, while table games win rose 14.8% to $152.7 million. The table games win percentage improved to 23.9% from 21.8%.
RevPAR increased 2.5% to $501, while the average daily rate rose 4.9% to $575. Occupancy declined to 87.1% from 89.2% in the year-ago quarter.
WYNN’s Encore Boston Harbor
In the second quarter, Encore Boston Harbor’s operating revenues amounted to $209.3 million compared with $215.7 million in the prior-year quarter. Casino revenues fell 5.9% to $152.1 million.
Rooms and food and beverage revenues increased 9.7% and 7.4% to $25.1 million and $20.1 million, respectively. Entertainment, retail and other revenues declined 3.9% to $12 million.
Adjusted Property EBITDAR decreased 12.2% to $56.1 million from $63.9 million. The table games win percentage fell to 18.1% from 21.3%.
RevPAR increased 9.6% to $412, while the average daily rate rose 9.9% to $445. Occupancy was 92.7% compared with 92.9% in the prior-year quarter.
Wynn Resorts’ Q2 Operating Performance
In the second quarter, Adjusted Property EBITDAR totaled $568.3 million compared with $552.4 million in the year-ago quarter. The consolidated margin declined to 30.6% from 31.8%.
Operating income increased to $297.6 million from $264.6 million reported in second quarter 2025. Net income attributable to Wynn Resorts rose to $140.1 million from $66.2 million reported in the prior year quarter.
WYNN’s Cash Position and Capital Returns
As of June 30, 2026, cash and cash equivalents totaled $1.57 billion, excluding $527.4 million of short-term investments held by Wynn Macau. Total current and long-term debt outstanding was $10.72 billion.
The company repurchased 741,098 shares for $75 million during the quarter. Wynn Resorts also declared a cash dividend of 25 cents per share, payable Aug. 28, 2026. Wynn Al Marjan Island is expected to open in September 2027.
WYNN’s Zacks Rank & Key Picks
Wynn Resorts currently has a Zacks Rank #4 (Sell).
Some better-ranked stocks from the Zacks Consumer-Discretionary sector are Life Time Group Holdings, Inc. LTH, The Marcus Corporation MCS and AMC Entertainment Holdings, Inc. AMC.
Life Time Group presently sports a Zacks Rank #1 (Strong Buy). You can see the complete list of today’s Zacks Rank #1 stocks here.
Life Time Group delivered a trailing four-quarter earnings surprise of 9.50%, on average. The stock has surged 68.3% in the year-to-date period. The Zacks Consensus Estimate for LTH’s 2026 sales and EPS implies growth of 11.5% and 19.4%, respectively, from the year-ago levels.
Marcus currently sports a Zacks Rank #1. The company delivered a trailing four-quarter earnings miss of 34.2%, on average. The stock has gained 100.7% in the year-to-date period.
The Zacks Consensus Estimate for Marcus’ 2026 sales and EPS indicates growth of 8.3% and 605.9%, respectively, from the year-ago period’s levels.
AMC Entertainment presently has a Zacks Rank #2 (Buy). The company delivered a trailing four-quarter earnings surprise of 321.7%, on average. The stock has rallied 71.8% in the year-to-date period.
The Zacks Consensus Estimate for AMC Entertainment’s 2026 sales and EPS indicates an increase of 13.3% and 77.1%, respectively, from the year-ago levels.
Research Chief Names "Single Best Pick to Double"
From thousands of stocks, 5 Zacks experts each have chosen their favorite to skyrocket +100% or more in months to come. From those 5, Director of Research Sheraz Mian hand-picks one to have the most explosive upside of all.
This company targets millennial and Gen Z audiences, generating nearly $1 billion in revenue last quarter alone. A recent pullback makes now an ideal time to jump aboard. Of course, all our elite picks aren’t winners but this one could far surpass earlier Zacks’ Stocks Set to Double like Nano-X Imaging which shot up +129.6% in little more than 9 months.
Free: See Our Top Stock And 4 Runners UpWant the latest recommendations from Zacks Investment Research? Today, you can download 7 Best Stocks for the Next 30 Days. Click to get this free report
Wynn Resorts, Limited (WYNN): Free Stock Analysis Report
Marcus Corporation (The) (MCS): Free Stock Analysis Report
AMC Entertainment Holdings, Inc. (AMC): Free Stock Analysis Report
Life Time Group Holdings, Inc. (LTH): Free Stock Analysis Report
This article originally published on Zacks Investment Research (zacks.com).