


Suncor Energy Inc. SU reported second-quarter 2026 adjusted operating earnings of $2.33 per share, which beat the Zacks Consensus Estimate of $2.14 by 8.9%. Moreover, the bottom line increased significantly from the year-ago quarter’s reported figure of 51 cents. The outperformance was driven by stronger downstream margins, higher upstream price realizations and increased refined product sales volumes.
The Calgary, Alberta-based integrated oil and gas company’s operating revenues of $12.7 billion beat the Zacks Consensus Estimate of $10.3 billion by 22.4%. The top line also increased approximately 47.3% year over year, aided by record refined product sales, higher refinery production and stronger benchmark crack spreads.
Suncor Energy Inc. Price, Consensus and EPS Surprise
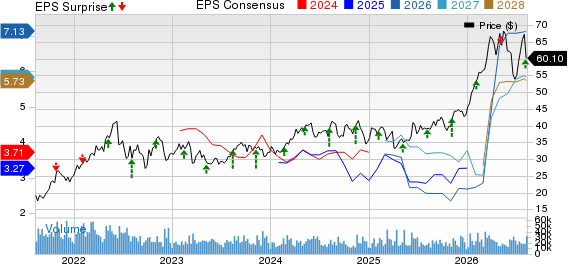
Suncor Energy Inc. price-consensus-eps-surprise-chart | Suncor Energy Inc. Quote
Suncor Energy’s board of directors declared a quarterly dividend of 60 Canadian cents per share for its common shareholders of record as of Sept. 4, 2026. The payout, which remains unchanged from the previous quarter, will be made on Sept. 25.
During the quarter, the company distributed a total of C$1.8 billion to its shareholders, including over C$1 billion in share repurchases and over C$700 million in dividends. It generated C$5.3 billion in adjusted funds from operations and C$4 billion in free cash flow.
During the second quarter, Suncor Energy delivered upstream production of 760,900 barrels per day (bbls/d), down from 808,100 bbls/d in the year-ago quarter. However, refining throughput reached a second-quarter record of 470,600 bbls/d, compared with 442,300 bbls/d a year earlier, while refined product sales rose to 654,800 bbls/d from 600,500 bbls/d in the prior-year period.
Q2 Segmental Performance of SU
Upstream: The company recorded a total production of 760,900 bbls/d, down from 808,100 bbls/d in the year-ago quarter. However, the figure beat the consensus estimate of 755,000 bbls/d.
Total Oil Sands production was 690,100 bbls/d, down from 748,400 bbls/d in the year-ago quarter. Total Oil Sands bitumen production was 815,200 bbls/d, compared with 860,800 bbls/d in the prior-year period. This decrease was caused by the planned turnaround at Firebag.
Net synthetic crude oil and diesel production increased to 482,200 bbls/d from 438,200 bbls/d a year earlier, driven by fewer maintenance activities in the current quarter. Non-upgraded bitumen production decreased to 207,900 bbls/d from 310,200 bbls/d, primarily due to increased upgrader availability and decreased bitumen production.
Oil Sands adjusted operating earnings were C$2.6 billion, up from C$926 million in the prior-year quarter, backed by increased price realizations.
Exploration and Production (E&P) production rose to 70,800 bbls/d from 59,700 bbls/d in the year-ago period, driven by strong production across assets. Adjusted operating earnings in the segment increased to C$465 million from C$165 million, primarily driven by higher sales volumes and stronger price realizations.
Downstream: The segment was the key driver of the quarter’s strength. Refining and Marketing adjusted operating earnings surged to C$2.1 billion from C$404 million in the prior-year quarter, primarily fueled by higher benchmark crack spreads, a FIFO inventory valuation gain and increased refinery production and sales volumes. Refinery utilization was 92%, up from 87% in the prior-year quarter, reflecting Suncor Energy’s increased refining network nameplate capacity of 511,000 bbls/d.
Refined product sales climbed to 654,800 bbls/d, a 9% increase from 600,500 bbls/d in the prior-year quarter, supported by global market opportunities, including record jet fuel sales, while also delivering more domestic volumes through high-value retail channels. Moreover, the figure beat the consensus estimate of 596,000 bbls/d.
SU’s Financial Position
Total expenses increased 20% to C$12.6 billion from the prior-year quarter. The cost of purchases of crude oil and products increased to C$6.4 billion in the second quarter of 2026, compared with C$5.1 billion in the prior-year quarter. Operating, selling and general expenses increased 8.1% to C$3.4 billion from the prior-year quarter, and Exploration expenses increased to C$17 million compared with C$4 million in the previous-year quarter.
Suncor Energy generated C$5.3 billion in adjusted funds from operations, up from C$2.7 billion in the prior-year quarter. Free funds flow increased to almost C$4 billion from C$981 million. The company returned nearly C$1.8 billion to its shareholders, including C$1 billion in share repurchases and over C$700 million in dividends.
Capital expenditures totaled C$1.3 billion, decreasing from the year-ago quarter of C$1.6 billion. As of June 30, 2026, Suncor Energy had cash and cash equivalents of C$5.4 billion and long-term debt of C$9.2 billion. Its debt-to-capitalization was 16%.
2026 Guidance by Suncor Energy
Suncor Energy’s 2026 corporate guidance targets total production of 840,000-870,000 bbl/d, including 785,000-810,000 bbl/d from Oil Sands and 55,000-60,000 bbl/d from Exploration and Production. Refinery throughput is expected at 460,000-475,000 bbl/d, with utilization of 90%-93% and refined product sales of 600,000-620,000 bbl/d. Capital expenditures are guided at C$5.6-C$5.8 billion, led by C$3.8-C$3.9 billion for Oil Sands. Cash operating costs are expected at C$26-C$29/bbl for Oil Sands operations, C$33-C$36/bbl at Fort Hills and C$34-C$37/bbl at Syncrude. The guidance assumes Brent at $87/bbl and WTI at $80/bbl, while the company highlights operational reliability, maintenance execution, commodity prices and infrastructure as key factors that could affect results.
SU currently has a Zacks Rank #3 (Hold). You can see the complete list of today’s Zacks #1 Rank (Strong Buy) stocks here.
Important Earnings at a Glance
While we have discussed SU’s second-quarter results in detail, let us take a look at three other key reports in this space.
Imperial Oil Limited IMO reported second-quarter 2026 adjusted earnings per share of $3.27, which beat the Zacks Consensus Estimate of $2.99 and increased from the year-ago quarter’s $1.34, driven by higher price realizations.
Revenues of $11.6 billion missed the Zacks Consensus Estimate of $11.8 billion. However, the top line increased significantly from the year-ago quarter’s level of $8.1 billion, backed by strong performance in both the Upstream and Downstream segments.
As of June 30, 2026, Imperial Oil had cash and cash equivalents of C$2.8 billion. Total debt of the company amounted to C$3.96 billion, with a debt-to-capitalization of 13.9%.
Pembina Pipeline Corporation PBA reported second-quarter 2026 earnings per share of 48 cents, which missed the Zacks Consensus Estimate of 49 cents. However, it increased from the year-ago quarter’s level of 47 cents. This improvement was primarily driven by strong underlying operational performance and volume growth across the Pipelines and Facilities and Marketing & New Ventures divisions.
This Calgary-based oil and gas storage and transportation company’s quarterly sales of $1.55 billion increased about 20% year over year, driven by higher revenue performance across all three segments.
As of June 30, 2026, PBA had cash and cash equivalents worth C$153 million and C$19.8 billion in long-term debt. Debt-to-capitalization was 53.7%.
Diamondback Energy, Inc. FANG reported second-quarter 2026 adjusted earnings per share of $6.48, which beat the Zacks Consensus Estimate of $5.96 and more than doubled from the year-ago adjusted profit of $2.67. The outperformance was driven by production growth and a 53.1% improvement in the year-over-year realized oil prices.
This Midland, TX-based oil and gas exploration and production company’s revenues of $5.6 billion increased more than 51% from the year-ago quarter and topped the Zacks Consensus Estimate by about 17%, fueled primarily by higher sales of oil, natural gas and natural gas liquids, increased sales of purchased oil and higher revenues from other operating income.
As of June 30, the Permian-focused operator had approximately $462 million in cash and cash equivalents and $11.1 billion in long-term debt, representing a debt-to-capitalization of 20.1%.
Zacks' Research Chief Names "Stock Most Likely to Double"
Our team of experts has just released the 5 stocks with the greatest probability of gaining +100% or more in the coming months. Of those 5, Director of Research Sheraz Mian highlights the one stock set to climb highest.
This top pick is a little-known satellite-based communications firm. Space is projected to become a trillion dollar industry, and this company's customer base is growing fast. Analysts have forecasted a major revenue breakout in 2025. Of course, all our elite picks aren't winners but this one could far surpass earlier Zacks' Stocks Set to Double like Hims & Hers Health, which shot up +209%.
Free: See Our Top Stock And 4 Runners UpWant the latest recommendations from Zacks Investment Research? Today, you can download 7 Best Stocks for the Next 30 Days. Click to get this free report
Suncor Energy Inc. (SU): Free Stock Analysis Report
Imperial Oil Limited (IMO): Free Stock Analysis Report
Pembina Pipeline Corp. (PBA): Free Stock Analysis Report
Diamondback Energy, Inc. (FANG): Free Stock Analysis Report
This article originally published on Zacks Investment Research (zacks.com).