


Newmont Corporation NEM has a strong liquidity position and generates substantial cash flows, which allow it to fund its growth projects and drive shareholder value. At the end of the second quarter of 2026, Newmont had robust liquidity of roughly $13 billion, including cash and cash equivalents of around $9 billion.
NEM’s strong liquidity profile and substantial cash flows provide it with ample flexibility to fund expansion projects, reduce debt and enhance returns. The company remains focused on investing in its organic growth initiatives, leveraging a strong balance sheet. It is pursuing several projects, including the Cadia Panel Caves and Tanami Expansion 2 in Australia. These projects should expand Newmont’s production capacity and extend mine life, driving revenues and profits.
Newmont also remains committed to deleveraging, reducing debt by roughly $3.4 billion in 2025. It ended the second quarter with a strong net cash position of $3.4 billion and remains actively focused on managing its debt.
The company generated $3.6 billion from its portfolio optimization actions in 2025. These funds will support Newmont’s capital allocation strategy, which focuses on reinforcing its balance sheet and delivering returns to its shareholders.
Looking across the competitive landscape, Kinross Gold Corporation KGC had strong liquidity of $4.4 billion at the end of the second quarter. KGC’s cash and cash equivalents were around $2.7 billion at the end of the quarter. With $1.7 billion in available credit (as of June 30, 2026) and no debt maturities until 2033, Kinross is well-positioned to support growth while strengthening its balance sheet and delivering shareholder value.
Agnico Eagle Mines Limited AEM has a robust liquidity position and generates healthy cash flows, enabling it to maintain a strong exploration budget and finance a robust pipeline of growth projects. AEM ended the second quarter with cash and cash equivalents of roughly $3.5 billion. Agnico Eagle ended the quarter with a significant net cash position of roughly $3.3 billion, driven by an increase in cash.
The Zacks Rundown for NEM
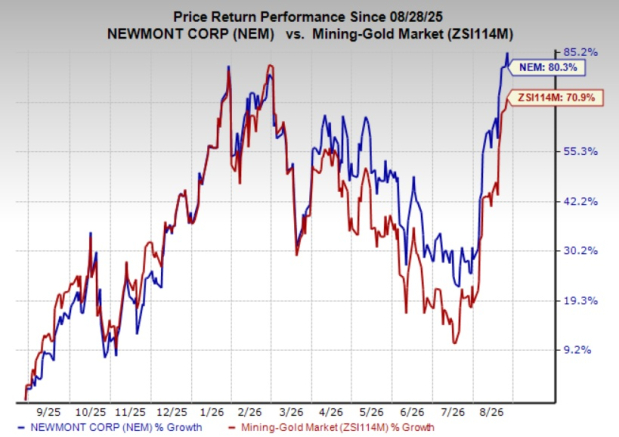
Shares of Newmont have shot up 80.3% in the past year against the Zacks Mining – Gold industry’s rise of 70.9%.
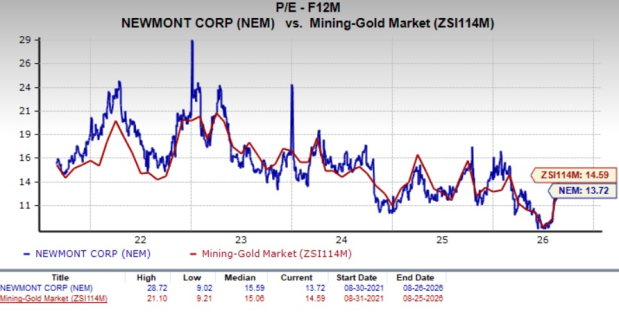
From a valuation standpoint, NEM is currently trading at a forward 12-month earnings multiple of 13.72, a modest 6% discount to the industry average of 14.59X. It carries a Value Score of B.
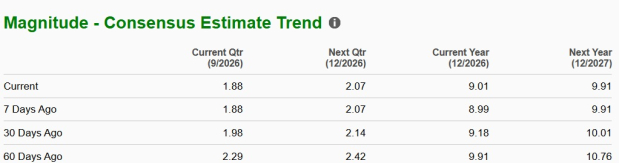
The Zacks Consensus Estimate for NEM’s 2026 and 2027 earnings implies a year-over-year rise of 30.8% and 10%, respectively. The EPS estimates for 2026 and 2027 have been trending lower over the past 60 days.
NEM stock currently carries a Zacks Rank #4 (Sell).
You can see the complete list of today’s Zacks #1 Rank (Strong Buy) stocks here.
7 Best Stocks for the Next 30 Days
Just released: Experts distill 7 elite stocks from the current list of 220 Zacks Rank #1 Strong Buys. They deem these tickers "Most Likely for Early Price Pops."
Since 1988, the full list has beaten the market more than 2X over with an average gain of +23.9% per year. So be sure to give these hand picked 7 your immediate attention.
See them now >>Want the latest recommendations from Zacks Investment Research? Today, you can download 7 Best Stocks for the Next 30 Days. Click to get this free report
Newmont Corporation (NEM): Free Stock Analysis Report
Kinross Gold Corporation (KGC): Free Stock Analysis Report
Agnico Eagle Mines Limited (AEM): Free Stock Analysis Report
This article originally published on Zacks Investment Research (zacks.com).