


Opendoor Technologies Inc. OPEN has outlined a quantitative framework for reaching adjusted net income (ANI) breakeven on a 12-month go-forward basis by the end of 2026. The framework assumes roughly 6,000 quarterly transactions at $375,000 each, implying an annualized revenue run rate of approximately $9 billion.
Acquisition activity is moving toward the scale required by this model. OPEN generated 6,908 acquisition contracts in the second quarter, up from 5,136 in the first quarter. The company is also signing more than 500 contracts per week, with one recent week reaching roughly 700 — its highest weekly total in years. Still, contract volume does not translate directly into reported revenues. Some agreements will not close, while acquired homes generally progress through renovation, listing and resale before revenues are recognized.
Improving unit economics provides another important component of the profitability framework. Contribution margin reached 5.8% in the second quarter, within OPEN’s targeted 5-7% range. Operations expense per acquisition declined to $3,000 from $5,000 in the first quarter and $8,400 a year earlier. OPEN’s illustrative framework assumes that marketing, variable operations and fixed operating costs would represent a combined 2.9% of acquisition GMV. Based on the current dollar cost structure, these expenses would equal approximately 2.4% of revenues at a $9 billion run rate, below the 3-4% range previously associated with ANI profitability.
Still, maintaining these economics as volume expands will be critical. OPEN expects contribution margin to moderate to 4-4.5% in the third quarter because of seasonality and the temporary impact of the Doma integration. Net interest expense also remains slightly above 2% of revenues, increasing the importance of resale velocity and inventory discipline.
OPEN’s Breakeven Path Versus Zillow and Offerpad
Zillow Group, Inc. ZG provides an adjusted-earnings benchmark, although its digital marketplace is less capital intensive than OPEN’s inventory-based iBuying model. Zillow reported second-quarter adjusted net income of $118 million and adjusted EBITDA of $176 million, translating into an adjusted EBITDA margin of 23%. Zillow also noted that Zillow Home Loans now generates positive unit economics across fixed and variable costs, highlighting the operating leverage available from integrated real estate services.
Offerpad Solutions Inc. OPAD offers a more direct iBuying comparison. The company generated approximately $78 million in revenues from 295 real estate transactions and recorded an adjusted EBITDA loss of $6.2 million. Offerpad’s contribution profit after interest reached $13,500 per transaction. The company targets exiting 2026 at a run rate of roughly 1,000 quarterly transactions and attaining positive adjusted EBITDA on a year-end run-rate basis. Although Offerpad’s adjusted EBITDA objective is not directly comparable with OPEN’s adjusted net income target, both companies depend on transaction scale, resale velocity and disciplined inventory economics.
Taken together, OPEN’s higher contract activity, improved unit economics and lower operating expense per acquisition likely strengthen its prospects of reaching adjusted net income breakeven on a 12-month go-forward basis by year-end 2026.
OPEN’s Stock Price Performance, Valuation & Estimates
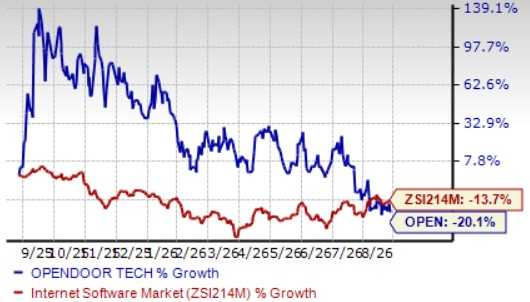
Shares of Opendoor have declined 20.1% in the past year compared with the industry’s 13.7% fall.
OPEN One-Year Price Performance
Image Source: Zacks Investment Research
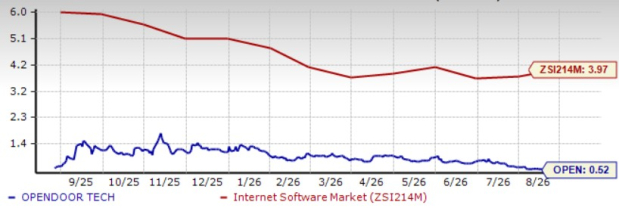
From a valuation standpoint, OPEN trades at a forward price-to-sales (P/S) multiple of 0.52, significantly below the industry’s average of 3.97.
OPEN’s P/S Ratio (Forward 12-Month) vs. Industry
Image Source: Zacks Investment Research
The Zacks Consensus Estimate for OPEN's 2026 loss per share suggests a 42.3% year-over-year improvement. Loss per share estimates for 2026 have widened in the past 30 days.
EPS Trend of OPEN Stock
Image Source: Zacks Investment Research

OPEN stock currently has a Zacks Rank #4 (Sell).
You can see the complete list of today’s Zacks #1 Rank (Strong Buy) stocks here.
7 Best Stocks for the Next 30 Days
Just released: Experts distill 7 elite stocks from the current list of 220 Zacks Rank #1 Strong Buys. They deem these tickers "Most Likely for Early Price Pops."
Since 1988, the full list has beaten the market more than 2X over with an average gain of +23.9% per year. So be sure to give these hand picked 7 your immediate attention.
See them now >>Want the latest recommendations from Zacks Investment Research? Today, you can download 7 Best Stocks for the Next 30 Days. Click to get this free report
Opendoor Technologies Inc. (OPEN): Free Stock Analysis Report
Zillow Group, Inc. (ZG): Free Stock Analysis Report
Offerpad Solutions Inc. (OPAD): Free Stock Analysis Report
This article originally published on Zacks Investment Research (zacks.com).